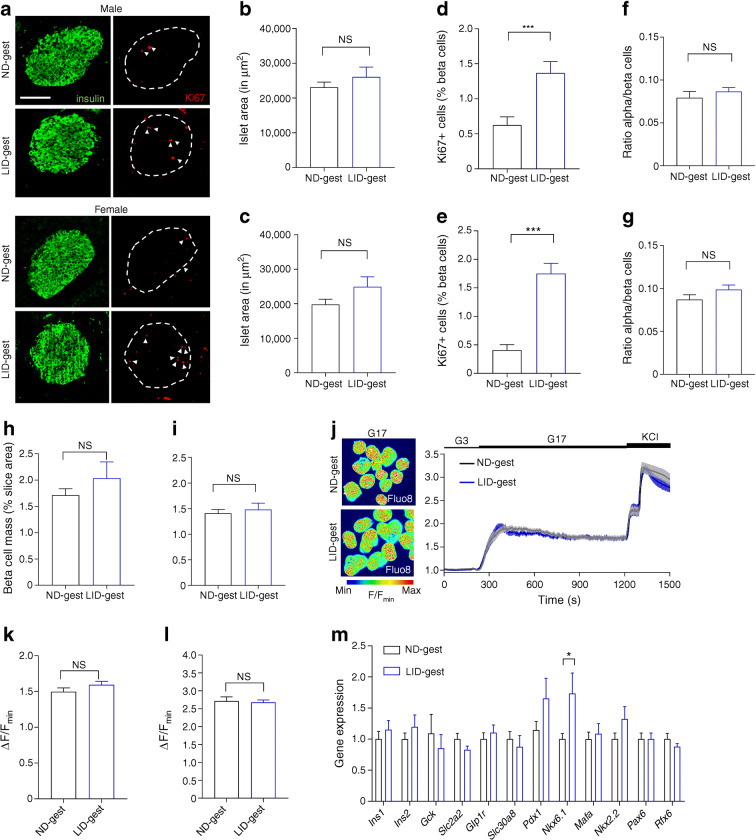
Fig. 3.
Gestational hypothyroidism alters beta cell proliferation without changes in calcium fluxes and beta cell identity. Adult offspring (8–10 weeks of age) were analysed. (a) Representative confocal images of pancreatic islets in male and female offspring (scale bar, 100 μm, 5 μm Z-projection; red, Ki67; green, insulin). Dashed circles delineate islets and arrowheads indicate Ki67+ beta cell nuclei. (b, c) Quantification of islet area in male (b) and female (c) offspring (n = 5 males and 10 females/group, Mann–Whitney U test). (d, e) Quantification of beta cell proliferation in male (d) and female (e) offspring (measured as % of beta cells positive for Ki67) (n = 5 males and 10 females/group, Mann–Whitney). (f, g) Quantification of alpha cell/beta cell ratio in male (f) and female (g) offspring (n = 5 males and 10 females/group, Mann–Whitney). (h, i) Beta cell mass, measured as ratio of insulin+ staining area by total slice area, in adult males (h) and females (i) (n = 3 mice/group, Mann–Whitney). (j–l) Representative images, with mean traces (right) and summary bar graphs (k, l) showing no changes in the amplitude of 17 mmol/l glucose- (k) and glucose + KCl- (l) stimulated Ca2+ rises in LID-gest male offspring (n = 44–61 islets/9–12 mice, Mann–Whitney). Note that the mean values in (j) do not correspond exactly to those in (k), since the time to Ca2+ peak following glucose stimulation was offset by 90 s in a number of islets. (m) Expression profiles of key beta cell markers in islets from male offspring, measured by RT-qPCR. Data were normalised by the geometric mean of Ppia and Mrpl32. Ct values are expressed as fold increase relative to offspring from ND-fed control. Data are presented as mean ± SEM (n = 10 mice/group, Mann–Whitney). *p < 0.05, ***p < 0.001 using the tests indicated above. Data are mean ± SEM. gest, gestation

