Fig. 1.
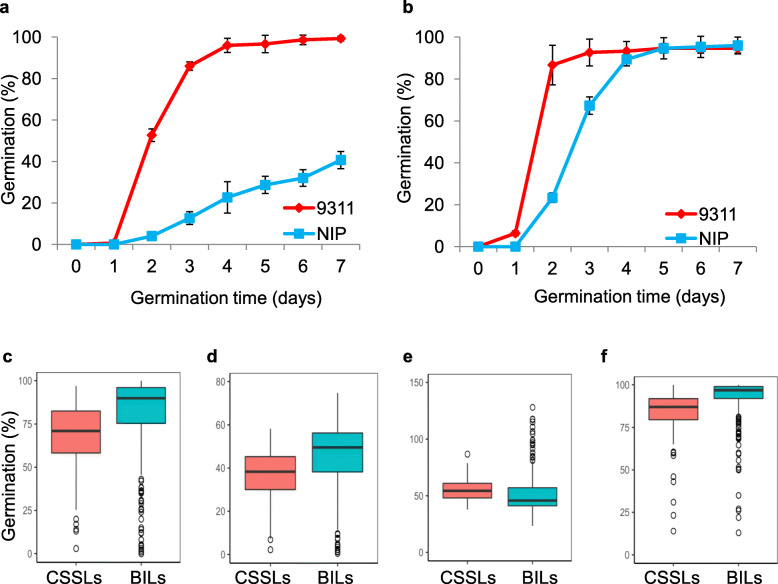
Differences in seed dormancy between Nipponbare (NIP) and 9311 and among chromosome segment substitution lines (CSSLs) and backcross inbred lines (BILs). a Germination curve of the freshly harvested seeds of NIP and 9311. b Germination curve of NIP and 9311 after seed dormancy was broken. The error bar represents the mean ± SD (n = 3). Boxplots of G3d (c), AUC (d), T50 (e), and G7d (f) in CSSLs and BILs. Box edges indicate the range of the 25th to 75th percentiles, with the median value shown by the bold middle line. Whiskers represent the range of 5% to 95% of the data, and outer dots are outliers. G3d, germination rate at 72 h after imbibition; G7d, maximum germination rate at 168 h after imbibition; T50, germination speed, which is the time to reach 50% germination of seeds; and AUC, the area under the curve up to 168 h after imbibition

