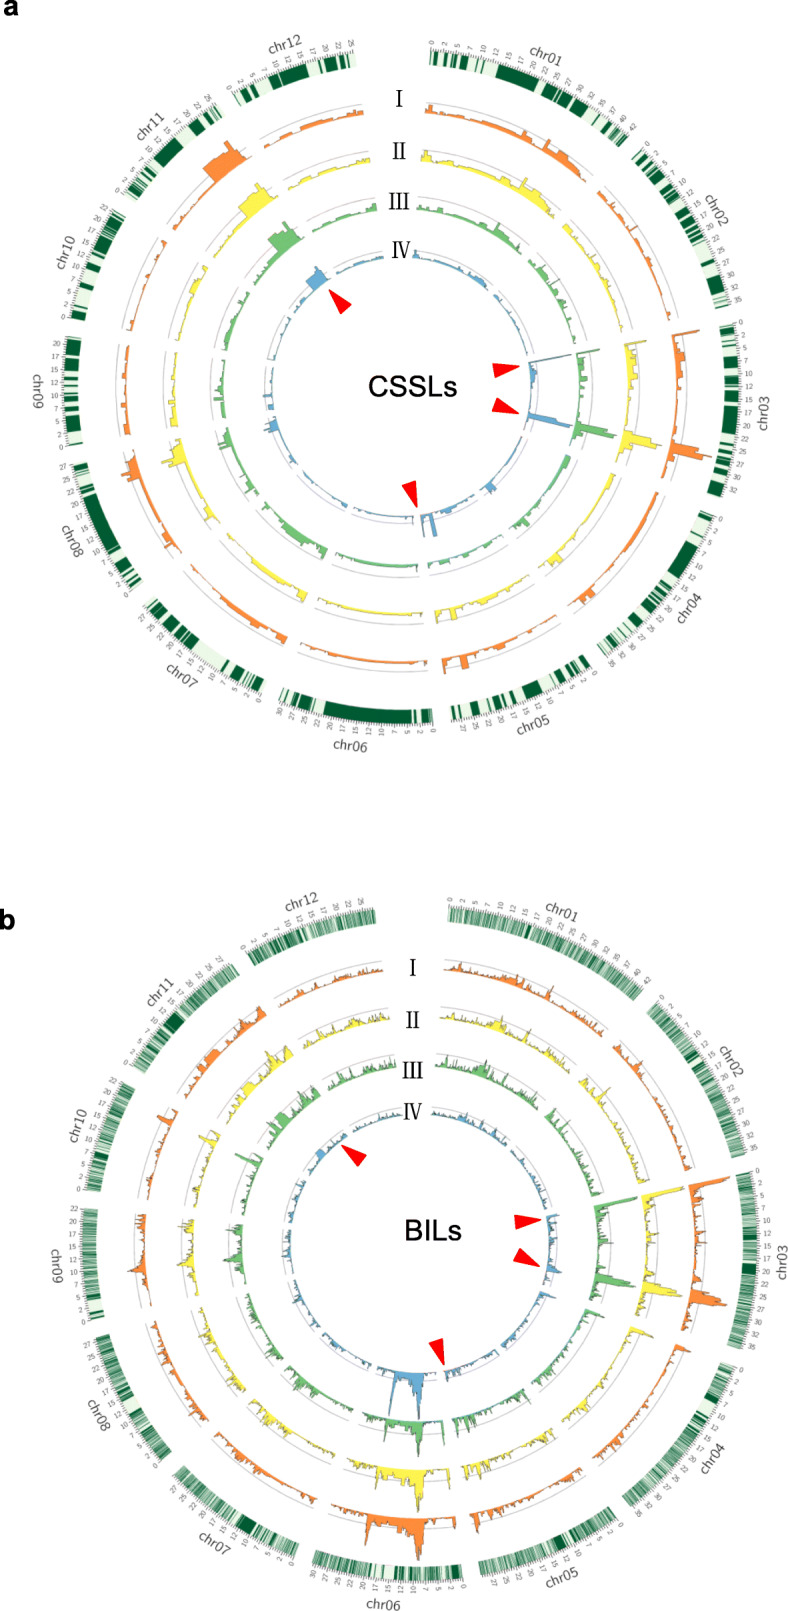
Fig. 2.

Genome-wide distribution of quantitative trait loci (QTLs) detected for four seed dormancy parameters in the two populations. a CSSLs (chromosome segment substitution lines). b BILs (backcross inbred lines). Rice chromosomes with bins are indicated in the outer circle. The outer to the inner circles represent G3d (I), AUC (II), T50 (III) and G7d (IV), respectively. G3d, germination rate at 72 h after imbibition; G7d, maximum germination rate at 168 h after imbibition; T50, germination speed, which is the time to reach 50% germination of seeds; and AUC, the area under the curve up to 168 h after imbibition. Red arrows represent the major loci associated with seed dormancy in both populations. For each bar diagram, the x-axis represents the physical location along each numbered chromosome. The y-axis represents the P value for the single-nucleotide polymorphism (SNP) association. Dashed lines indicate the declaration thresholds
