Fig. 5.
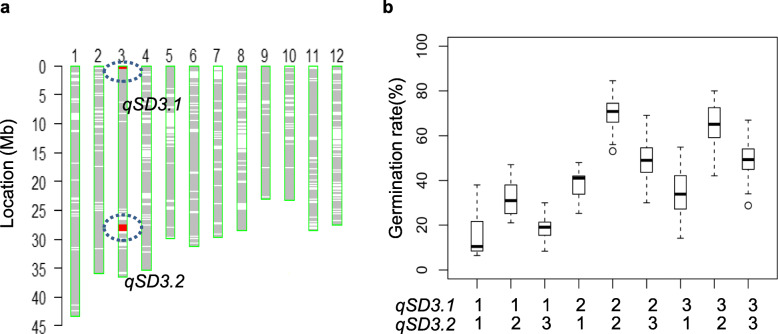
Epistatic interaction of qSD3.1 and qSD3.2. a Graphical genotype of one CSSL (NY61) encompassing qSD3.1 and qSD3.2. The red and green bars represent the Nipponbare (NIP) and 9311 genotypes, respectively. b Boxplots of nine genotypes at the two loci for germination rate at 72 h after imbibition in the NY61-derived population (n = 175). Box edges indicate the range of the 25th to 75th percentiles, with the median value shown by the bold middle line. “1”, “2” and “3” represent the NIP, 9311 and heterozygous genotypes, respectively

