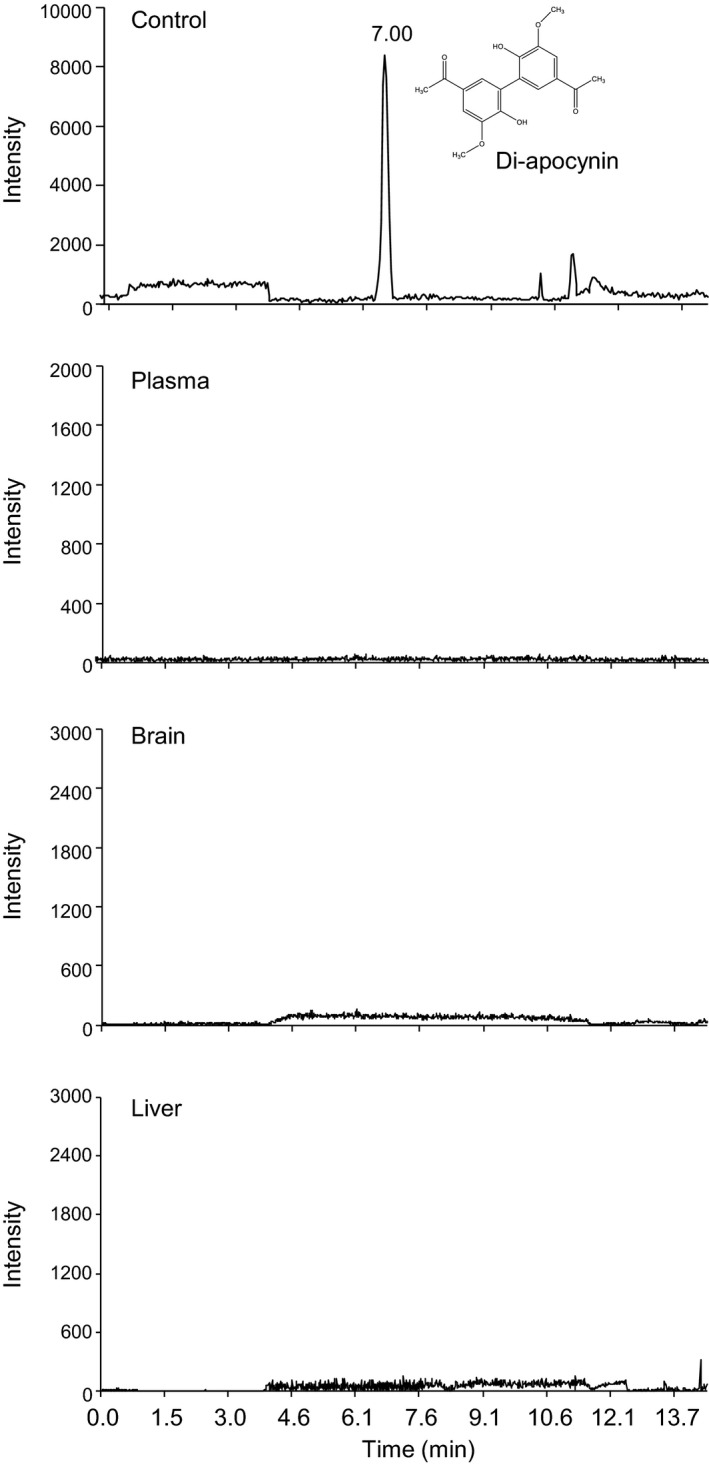
FIGURE 2.

Representative chromatograms of diapocynin detected using HPLC‐MS/MS. Control sample (top panel) was diapocynin (500 ng/mL) spiked into mouse plasma and was detected as a prominent peak at ~6.8‐7.2 min. Diapocynin was not detected in the plasma, brain, and liver samples after intravenous injection of apocynin. HPLC‐MS/MS, HPLC coupled to a quadrupole‐linear ion‐trap tandem mass spectrometry
