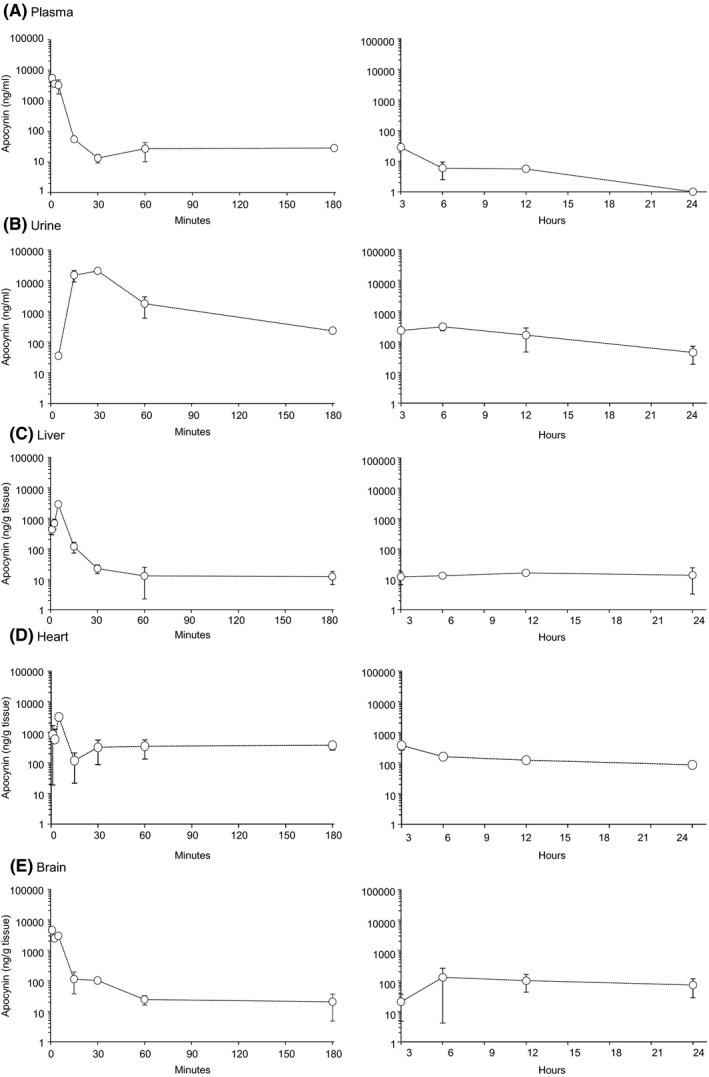
FIGURE 3.

Pharmacokinetic profile of apocynin post intravenous bolus (5 mg/kg) in different tissues. (A) Plasma, (B) Urine, (C) liver, (D) Heart, and (E) Brain. Left panels showed PK profiles from time 1‐180 min; Right panels showed PK profiles from 3‐24 h. Data were presented as Mean ± SD. n = 3 mice per time point
