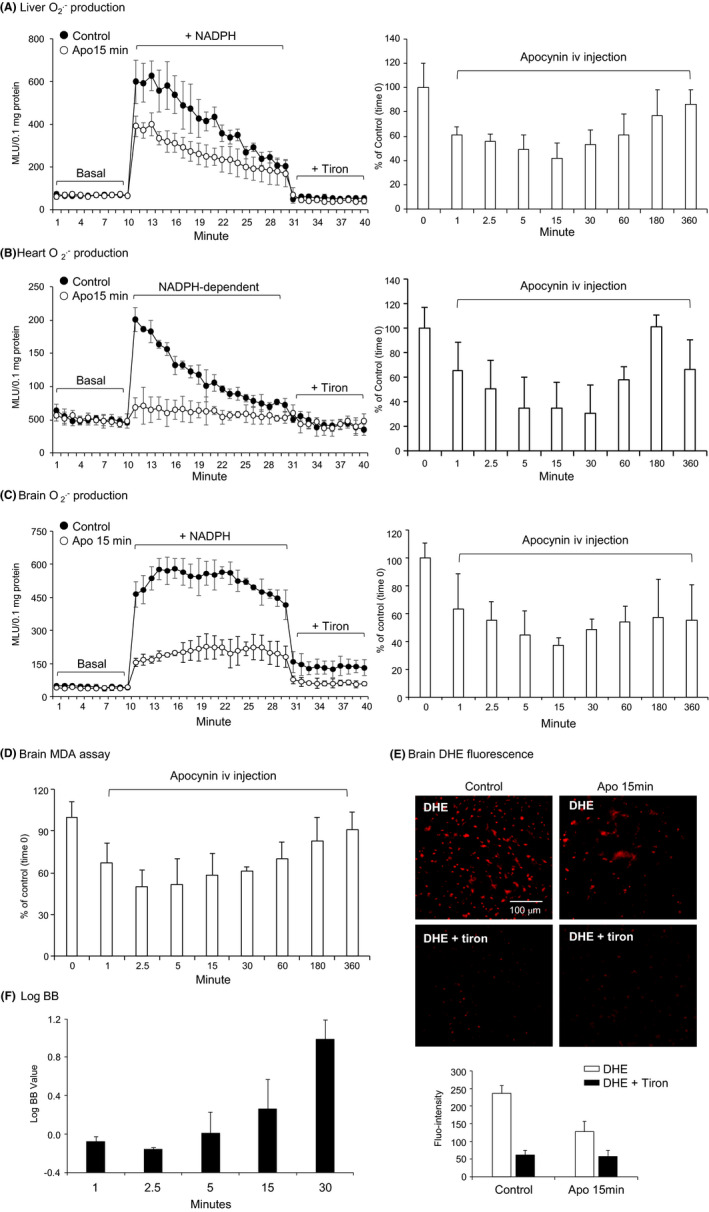
FIGURE 4.

Pharmacodynamic profile of apocynin on inhibiting the levels of reactive oxygen species (ROS) production by major organs. (A) liver, (B) heart, and (C‐F) brain. A‐C, production in tissue homogenates measured by lucigenin‐chemiluminescence. Left panels: Representative kinetic detection of production in samples collected at 15 min after apocynin intravenous (iv) injection. Controls were tissue samples without apocynin injection. Right panels: Time course (0‐360 min). n = 3 mice per time point. D, Levels of lipid peroxidation in brain tissues detected by malondialdehyde (MDA) assay. E, In situ ROS production detected by dihydroethidium (DHE) fluorescence on brain sections at 15 min after iv injection of apocynin. Control samples were brain section of mice without apocynin. Tiron was used to confirm the detection of . F, LogBB of apocynin after iv injection. Data were presented as Mean ± SD. n = 3 mice per time point
