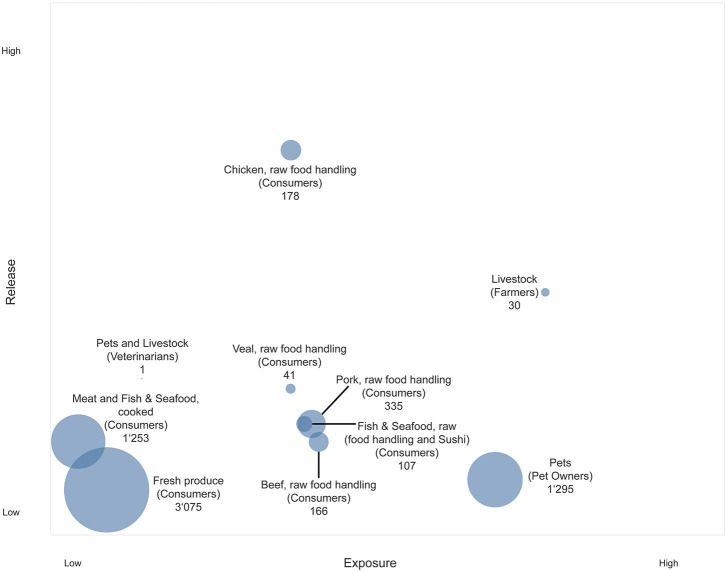
Figure 2.
Bubble chart representing the exposure of the Swiss population to AMR hazards originating from food and animal sources. Y-axis: Release of AMR hazards from different sources. X-axis: Exposure to sources of AMR hazards for different subpopulations. Bubble size: Person days at risk [million days per year].

