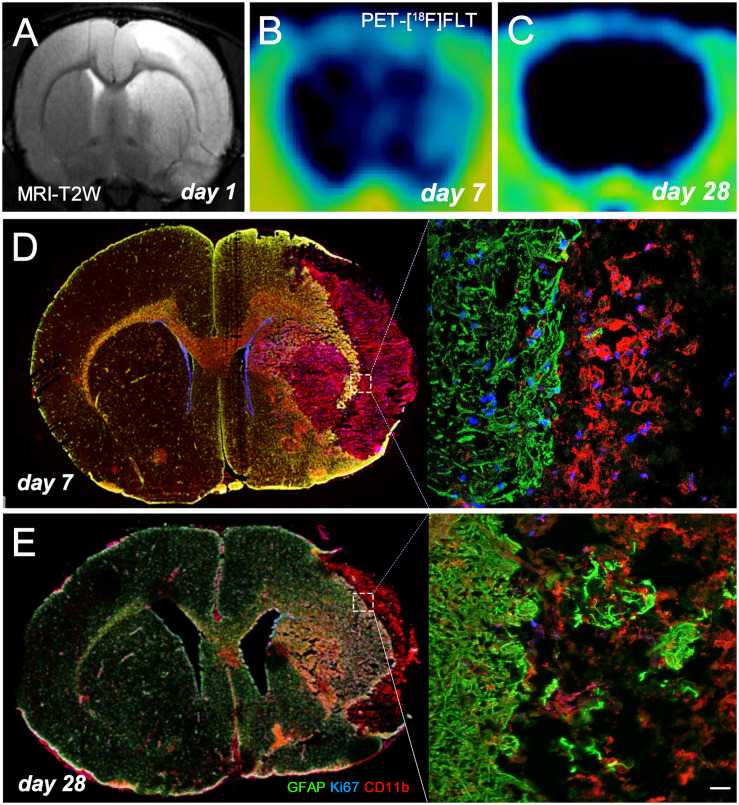
FIGURE 3.
MRI-T2W and [18F]FLT PET signal shows the vasogenic edema and the evolution of cerebral proliferation at days 1 (A), 7 (B), and 28 (C) after MCAO. Images correspond to the same animal. Immunofluorescent labeling of GFAP (green), Ki67 (blue) and CD11b (red) of an axial section at days 7 (D) and 28 (E) shows gliogenesis after cerebral ischemia. Scale bar, 20 μm.

