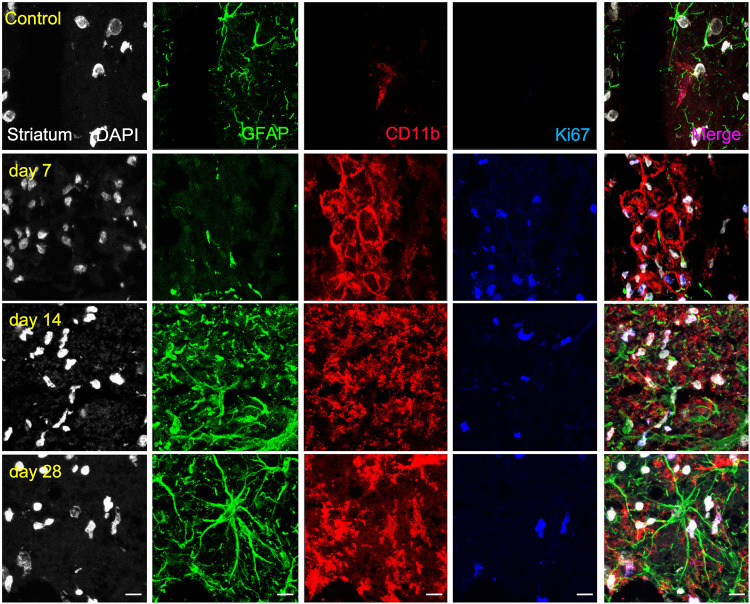
FIGURE 5.
Immunofluorescent labeling of DAPI (white), GFAP (green), CD11b (red) and Ki67 (blue) in the ischemic striatum, shown as four channels. The data show temporal evolution of striatal proliferative (Ki+) microglia/macrophages (CD11b+) and astrocytes (GFAP+) at day 0 (control; first row), day 7 (second row), day 14 (third row), and day 28 (fourth row) after ischemia. Scale bars, 10 μm.

