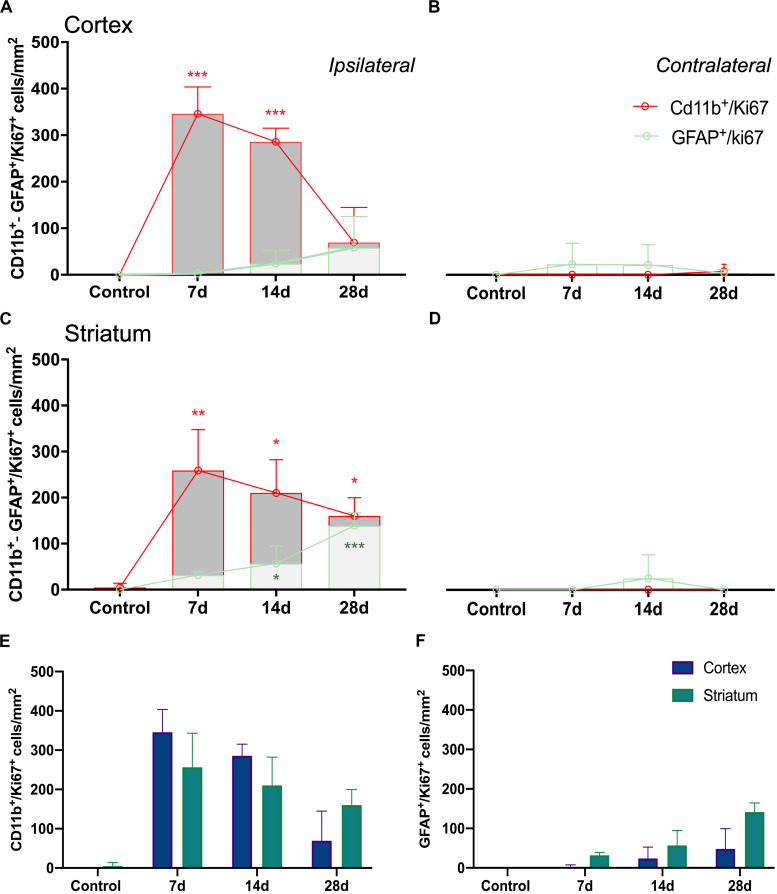
FIGURE 6.
Temporal profiles of CD11b+/Ki67+ and GFAP+/Ki67+ cells in four brain regions after ischemia onset. Ipsilateral cerebral cortex (A), contralateral cerebral cortex (B), ipsilateral striatum (C) and contralateral striatum (D) are shown. CD11b+/Ki67+ (E) and GFAP+/Ki67+ (F) cells show evolution of proliferative glial cells in cerebral cortex and striatum. Cell counts/mm2 were counted before (control) and days 7, 14, and 28 (n = 12, 4 rats/time point) after ischemia. *p < 0.05, **p < 0.01, ***p < 0.001 compared with control.

