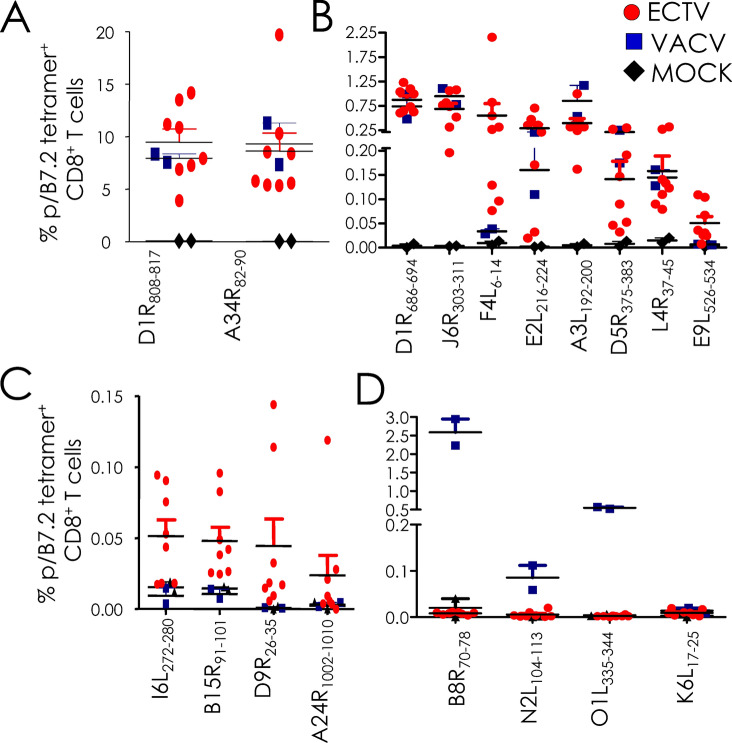
Figure 3.
Quantification of VACV- and ECTV-reactive CD8+ T cells responses in B7.2tg mice. Frequencies (% of CD8+) ECTV- and VACV-specific CD8+ T cells defined by epitope specific pB7.2 tetramer staining of splenocytes from infected animals based on the experiment in Fig. 2. Background staining was determined by irrelevant HMPV-derived CD8+ T cell-reactive epitope B7.2 tetramer binding or by staining of mock infected samples. Data are mean ± standard error of the mean (sem); ECTV (n = 8), VACV (n = 2) or mock (n = 2).

