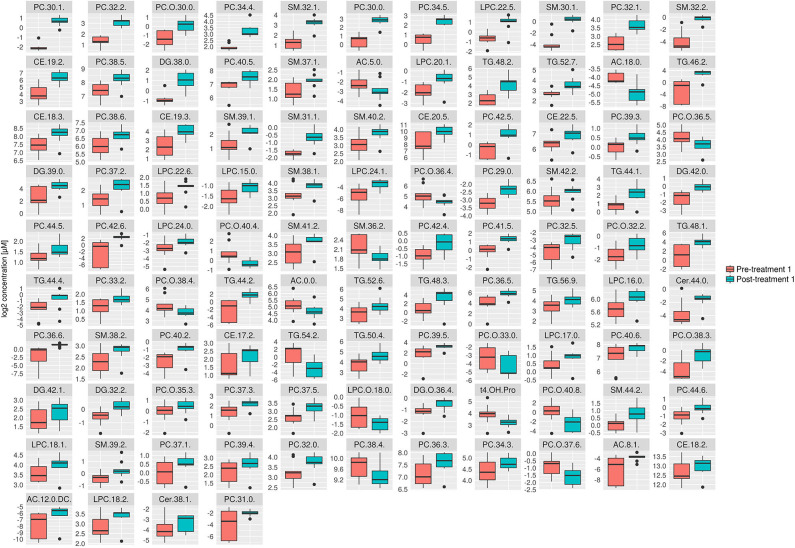
Figure 4.
Box plots of all significantly changes metabolites between pre- and post-treatment 1. Box plots of significantly changed metabolites (p ≤ 0.05 and q ≤ 0.2) for the comparison of pre-treatment (n = 9) and post-treatment 1 (n = 9) are shown on the cleaned, imputed and log2-transformed data set. Concentration unit is μM. Boxplots show the median (bar), the interquartile range (box), whiskers (range) corresponding to maximal and minimal data, and suspected outliers (filled circles).

