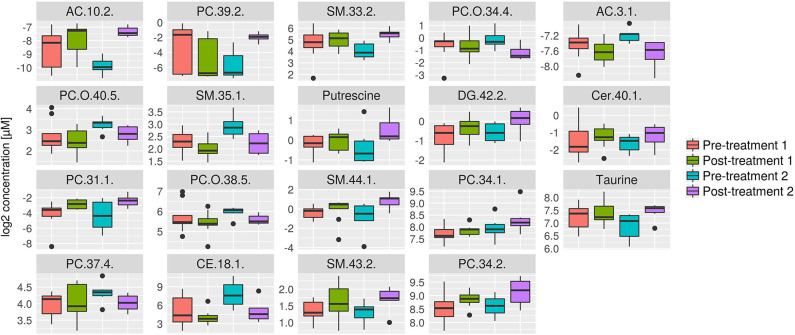
Figure 8.
Box plots of all metabolites that were significantly changed in response to treatment 2, but not in response to treatment 1. Concentration unit is μM. Boxplots show the median (bar), the interquartile range (box), whiskers (range) corresponding to maximal and minimal data, and suspected outliers (filled circles).

