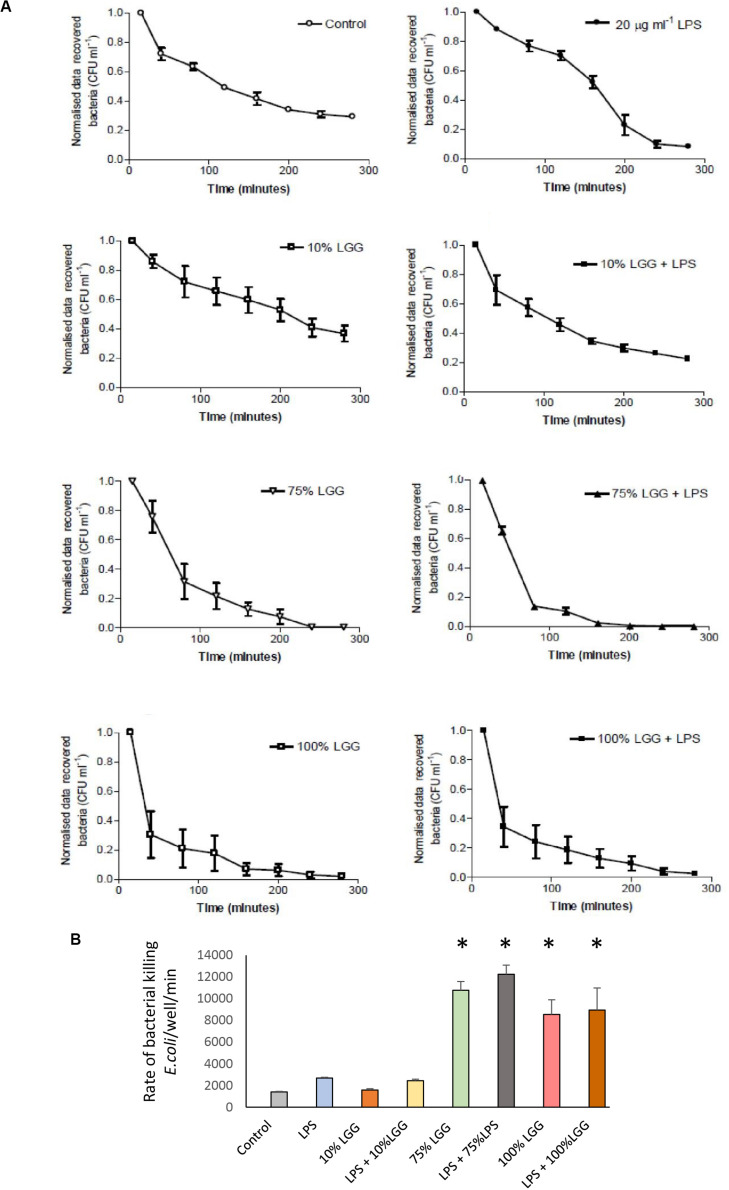
FIGURE 2.
Recovered intracellular E. coli bacteria from J774 macrophages during bacterial killing phase. (A) The graphs represent the number of bacterial colonies (CFU) recovered following gentamicin protection and were normalized by converting the starting CFU/mL to 1.0 in each condition. Data shows mean ± SD; all experiments were performed in duplicate and repeated at least three times. (B) The rate of bacterial killing, determined as described in the materials and methods, presented in column graph format. Significant differences (p < 0.05) are shown with the asterisk.

