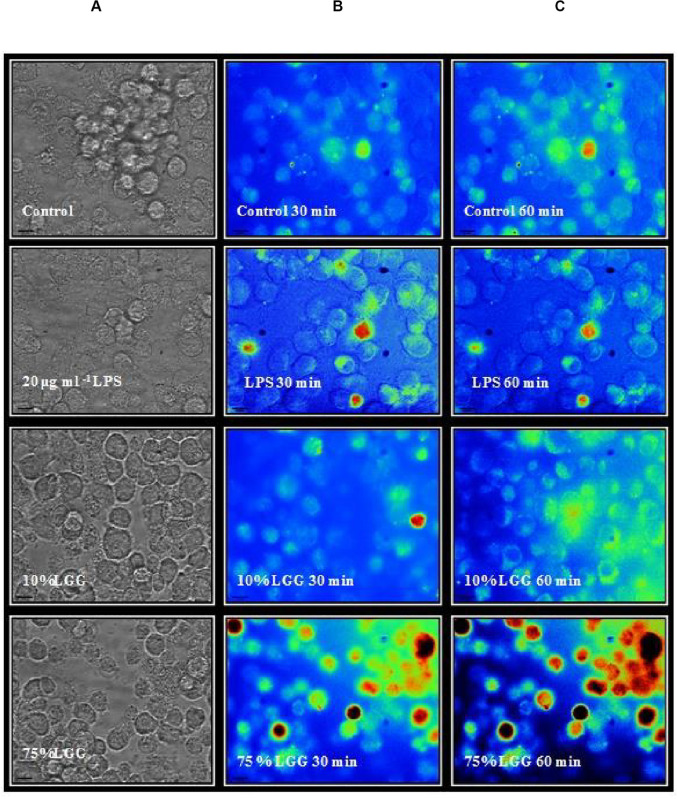
FIGURE 6.
Fluorescence microscopy imaging of ROS production in macophages. The macrophages were labeled with H2DCFDA and treated with 20 μg ml–1 LPS, 10 % LGG-CM, and 75 % LGG-CM for 30 and 60 min. The images are representative of one of the three experiments performed. The vertical panels illustrate adjacently placed bright field (A) and pseudo colored fluorescence images (B,C). Fluroescence corresponds to a heat map, blue = low, and red = high.

