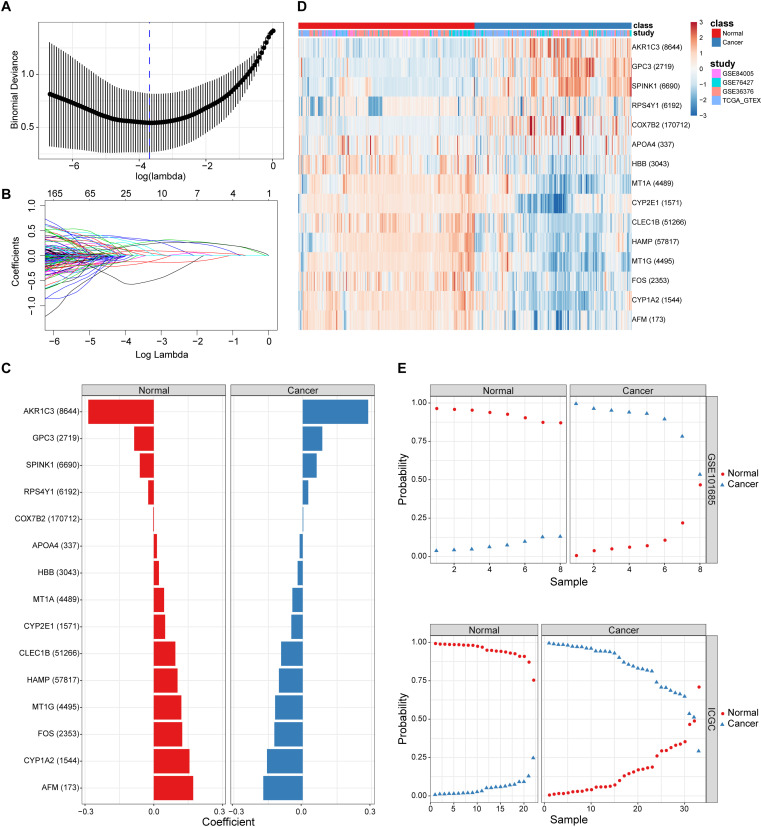
FIGURE 2.
The screening and validation of 15 genes conducted by the diagnostic classifier. (A,B) Binomial deviance as a function of the regularization parameter lambda for leave-one-study-out cross-validation on the training datasets. Points correspond to the means, and error bars correspond to the standard deviations. Coefficients of 15 genes were selected by the lambda with the minimum binomial deviance marked by the blue dashed line (lambda = 0.025, ln(lambda) = −3.692). (C) Coefficient values for each of the fifteen selected genes. A positive coefficient for a gene signature within its class indicates that elevated expression of this gene increases the probability of a specimen belonging to its tissue type. (D) Heatmap for describing the expression levels of selected genes in the binomial classifier erected by training datasets. Each row is a gene with its Entrez Gene ID in parentheses; each column is a sample. (E) Estimated probabilities for samples in testing datasets (GSE101685 and ICGC). For each sample, there are two points, corresponding to the probability that the sample belongs to the respective class. Within each dataset and class, samples are sorted by the probability of the true class. For most samples, the probability of the true subtype is near 1, indicating an unambiguous classification.

