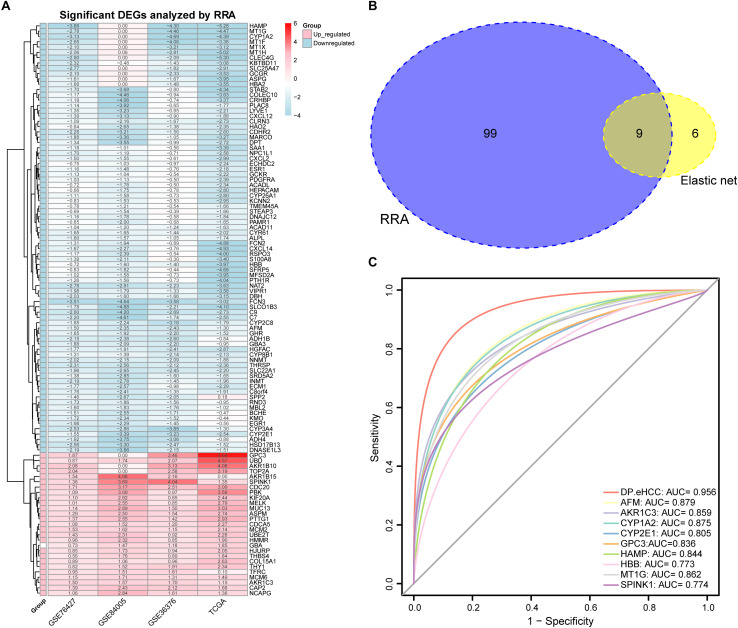
FIGURE 3.
Diagnostic performance of the DP.eHCC model selected by elastic net and RRA. (A) Heatmap showing the top 27 up-regulated genes and top 81 down-regulated genes in the training datasets (logFC > 1, adjusted p < 0.05). Each row represents one gene and each column indicates one dataset. Red indicates up-regulation and light blue represents down-regulation. DEGs: differentially expressed genes; RRA: robust rank aggregation. (B) As illustrated in the Venn Diagram, nine robust DEGs (AFM, AKR1C3, CYP1A2, CYP2E1, GPC3, HAMP, HBB, MT1G, and SPINK1) were identified by the intersection genes from the RRA (blue) and elastic net (yellow) analyses. (C) Receiver operating characteristic (ROC) curve analyses of the DP.eHCC model and its gene members for early HCC diagnosis. When compared with each gene member of the DP.eHCC model, the prediction efficiency of the DP.eHCC model was shown to be significantly enhanced (AUC = 0.956, p < 0.001).

