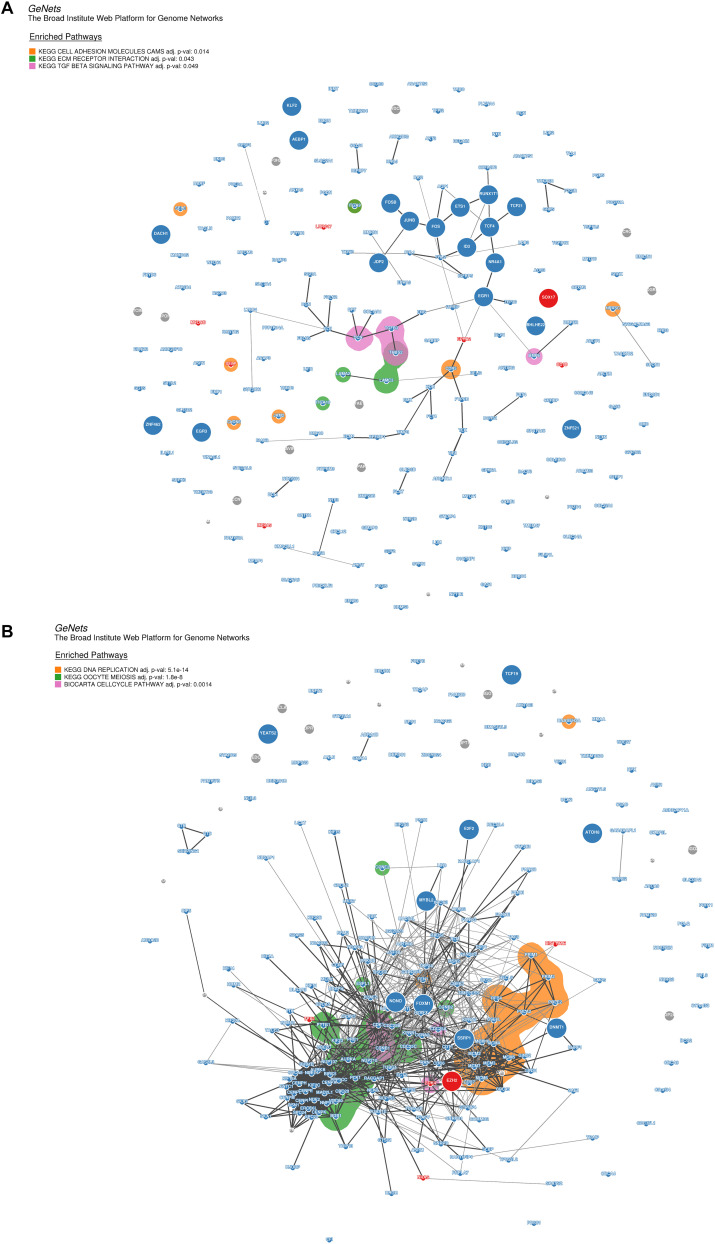
FIGURE 7.
Genome networks analysis of co-expressed genes in modules of weighted correlation network analysis (A) The genome network of co-expressed genes in turquoise module (B) The genome network of co-expressed genes in yellow module. Network nodes represent proteins (Size: large nodes represent transcription factor and small nodes do not represent transcription factor; Color: red module means having significant protein-altering mutations, blue module means having no significant protein-altering mutations, gray means not assigned), and network edges represent protein-protein associations (The edges have a score between (0,1) and the encoding is gray scale. The edges with higher scores represent darker edges and the edges with smaller scores represent lighter edges). KEGG pathways of nodes are based on the 853 expertly curated pathways from the Molecular Signatures Database (MSigDB), respectively. Overlay the enriched KEGG pathways on the network using bubble sets and code the square with different color.

