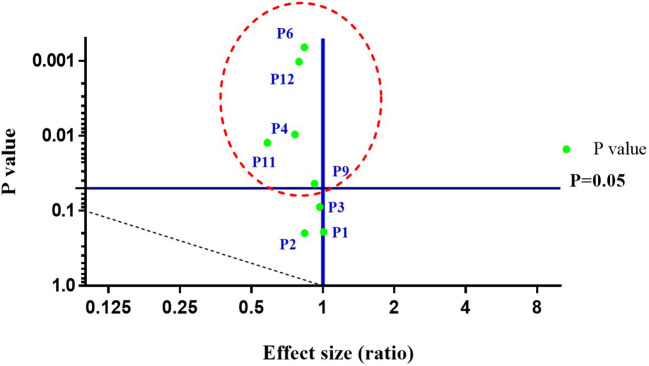
Figure 2.
A volcano plot representing effects of bacterial treatments on soil parameters before (0 DAS) and after harvesting (120 DAS) of C. annuum L. Where DAS: days after sowing; P1: pH; P2: Electric conductivity; P3: Organic carbon; P4: Phosphorus; P6: Zinc; P9: Iron; P11: Boron; P12: Copper. The parameters viz., P4, P6, P9, P11, and P12 represent strong statistical differences (p < 0.05). All the values are arithmetic mean ± SD; n = 6.

