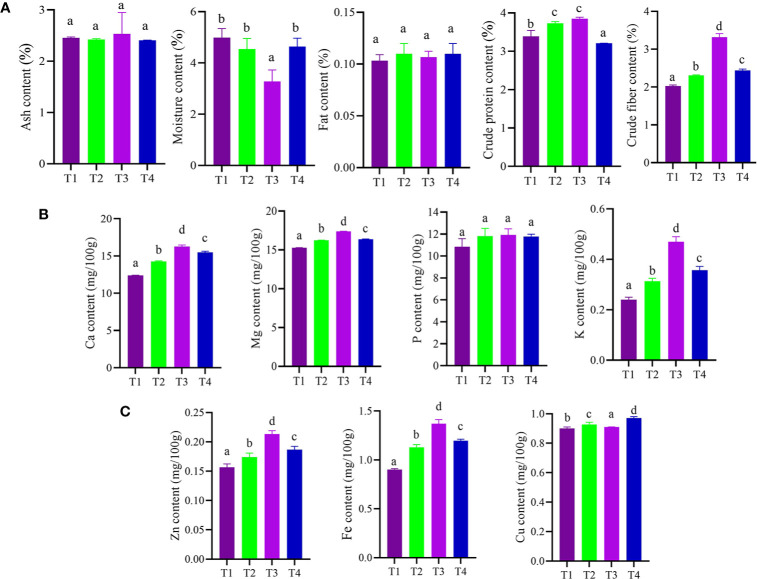
Figure 3.
(A) Effect of bacterial treatment on proximate constituents. (B) Effect of bacterial treatment on macronutrient contents. (C) Effect of bacterial treatment on micronutrient contents of C. annuum L. Where M: Moisture; CP: Crude protein; CF: Crude fiber; A: Ash; F: Fat; K: Potassium; Ca: Calcium; Mg: Magnesium; P: Phosphorus; Zn: Zinc; Fe: Iron; Cu: Copper; T1: Untreated control; T2: seeds + CDK15; T3: seeds + CDK25; T4: seeds + Consortium (CDK15 + CDK25). Values are expressed as mean ± SD (n = 6), Level of significance: p < 0.05; Values with different superscripts are significantly different (One-way ANOVA followed by Duncan’s multiple range tests).

