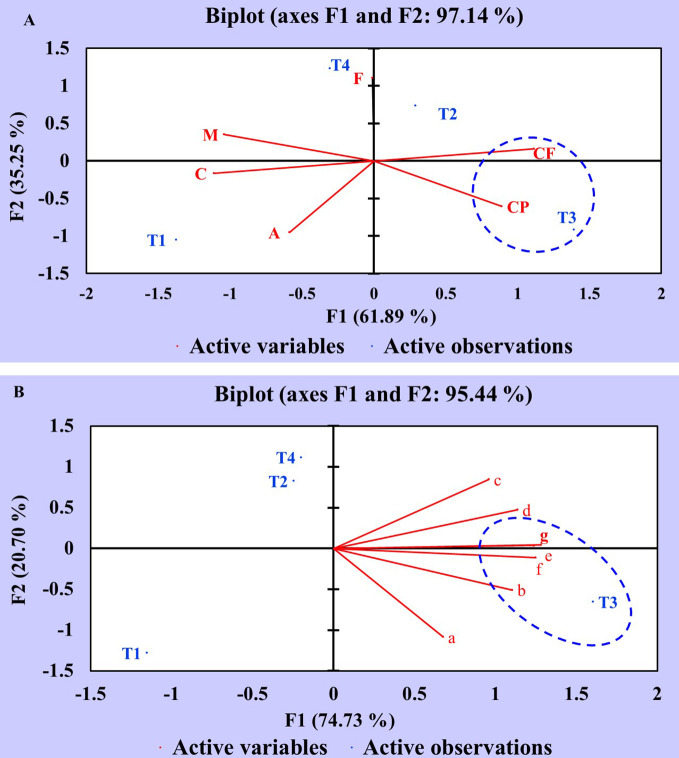
Figure 5.
Principal Component Analysis showing the correlation between the effect of different treatments and variables of C. annuum L. (A) Principal component analysis of different treatments and proximate chemical constituent variables. (B) Principal component analysis of different treatments and nutrient constituent variables. Where, treatments: T1: Untreated control; T2: seeds + CDK15; T3: seeds + CDK25; T4: seeds + Consortium (CDK15 + CDK25); M: Moisture, CP: Protein, CF: Crude Fiber, A: Ash, F: Fat, C: Carbohydrate, a: Calcium; b: Magnesium; c: Phosphorous; d: Potassium; e: Copper; f: Zinc; g: Iron.

