Figure 2.

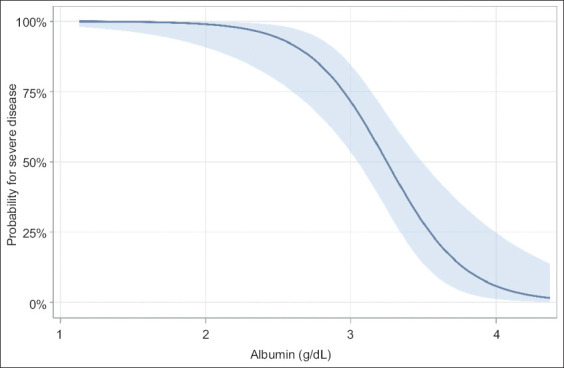
The predicted probability for severe disease in relation to albumin levels on admission
The continuous line indicates estimated probability from the multivariate model, while the shaded area represents the 95% confidence interval

The predicted probability for severe disease in relation to albumin levels on admission
The continuous line indicates estimated probability from the multivariate model, while the shaded area represents the 95% confidence interval