Figure 6.
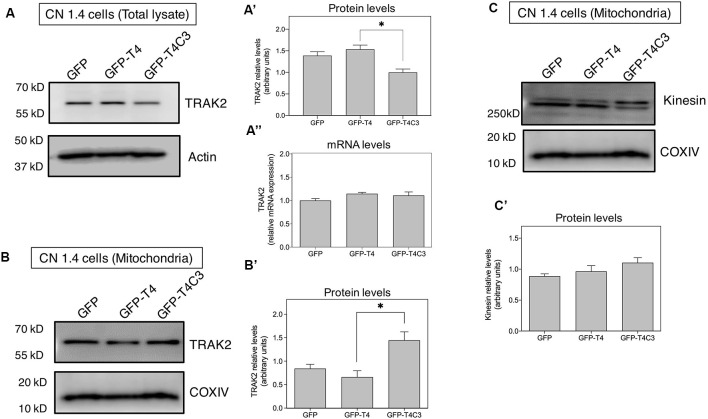
Truncated tau reduces TRAK2 expression and increases its association with mitochondrial fraction in immortalized cortical neurons. (A) Representative western blot images of CN 1.4 cells transfected with GFP, GFP-T4 (normal tau), and GFP-T4C3 (truncated tau) indicating the relative TRAK2 expression levels. Caspase-cleaved tau decreases TRAK2 expression compared with cells that were expressing GFP or GFP-T4 (normal tau). (A′) Quantitative analysis of the relative expression levels of TRAK2 in immortalized neurons transfected with indicated conditions. Data are mean ± SE, n = 5. *p < 0.05 indicates differences between groups calculated by ANOVA test. (A″) Total RNA was extracted from immortalized cortical neurons transfected with GFP, GFP-T4 (full-length tau), and GFP-T4C3 (truncated tau) and mRNA expression levels of TRAK2 were measured by RT-PCR. Data represent mean ± SE, n = 3. (B) Representative western blot images of CN 1.4 cells for mitochondrial extracts transfected with the conditions indicated. (B′) Quantitative graph showing that caspase-cleaved tau expression increases TRAK2 presence in mitochondrial extracts compared with cells transfected with the full-length tau form (GFP-T4). Data are mean ± SE, n = 4. *p < 0.05 indicates differences between groups calculated by ANOVA test. (C) Representative western blot images and quantitative analysis (C′) of kinesin 1 protein levels in mitochondrial extracts of CN 1.4 cells transfected with the conditions indicated (n = 4).

