Figure 7.
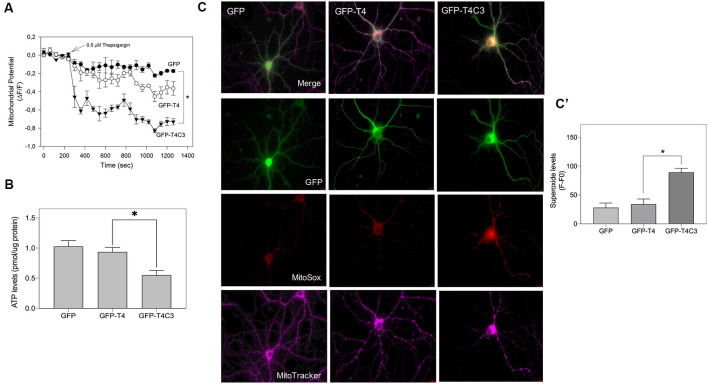
Caspase-3–cleaved tau expression reduces ATP production and mitochondrial membrane potential in immortalized cortical neurons. (A) CN 1.4 cells were transfected with the indicated conditions and loaded with MitoTracker red CM-H2XRos to evaluate mitochondrial membrane potential levels (Quintanilla et al., 2009, 2012, 2013, 2014; Pérez et al., 2018b). Cells were challenged with thapsigargin (0.5 μM, 30 min) to mobilize a small calcium concentration, and changes in mitochondrial potential were determined by live-cell imaging. Treatment with thapsigargin significantly decreases mitochondrial potential levels in cells transfected with caspase-cleaved tau (A). The graph shows representative plots of mitochondrial potential changes in cells transfected with the indicated conditions. Data represent the mean ± SE, n = 4. Statistical differences, *p < 0.05, were estimated using one-way ANOVA. (B) Immortalized cortical neurons were transfected with GFP, GFP-T4, and GFP-T4C3, and ATP levels were evaluated using a bioluminescence assay kit (see “Materials and Methods” section). Data represent the mean ± SE, n = 3. Statistical differences, *p < 0.05, were estimated using one-way ANOVA. (C) Representative fluorescence images of hippocampal neurons transfected with GFP, GFP-T4 (normal tau), and GFP-T4C3 (caspase-cleaved tau) loaded with MitoSox (superoxide indicator) and MitoTracker Deep Red (mitochondrial marker). Caspase-cleaved tau induces a significant increase in superoxide levels compared with cells positive for GFP-T4 (normal tau). (C′) Graph bars show a quantitative analysis of MitoSox fluorescence levels obtained from hippocampal neurons transfected with GFP, GFP-T4, and GFP-T4C3. Truncated tau increased superoxide production compared to neurons that expressed full-length tau (GFP-T4). Data are mean ± SE, n = 3. *p < 0.05 indicates differences between groups calculated by ANOVA test. Bar = 20 μm.

