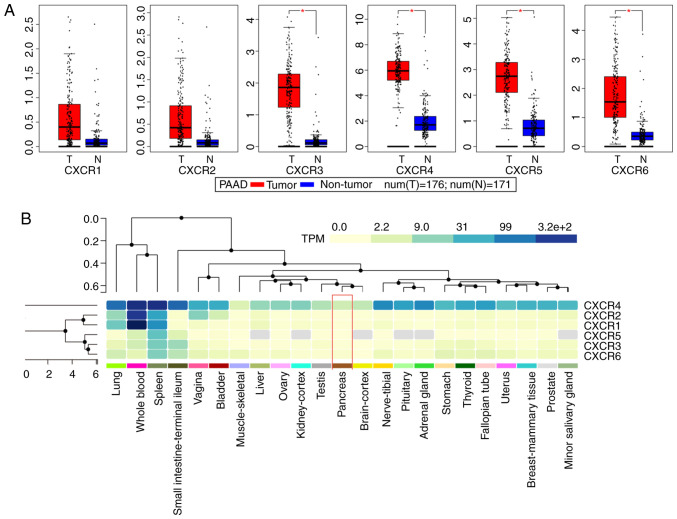
Figure 1.
Expression analysis of CXCR subunits. (A) Expression levels of CXCR subunits in The Cancer Genome Atlas pancreatic tumor and non-tumor tissues. Comparisons between groups were performed using unpaired Student's t-test. (B) Heatmap analysis of CXCR subunits expression in Genotype-Tissue Expression normal tissues. Red box indicates normal pancreatic tissue expression and the color of the cell indicates the level of expression. *P<0.05. CXCR, C-X-C motif chemokine receptor; T, tumor; N, normal; TPM, transcripts per kilobase million.

