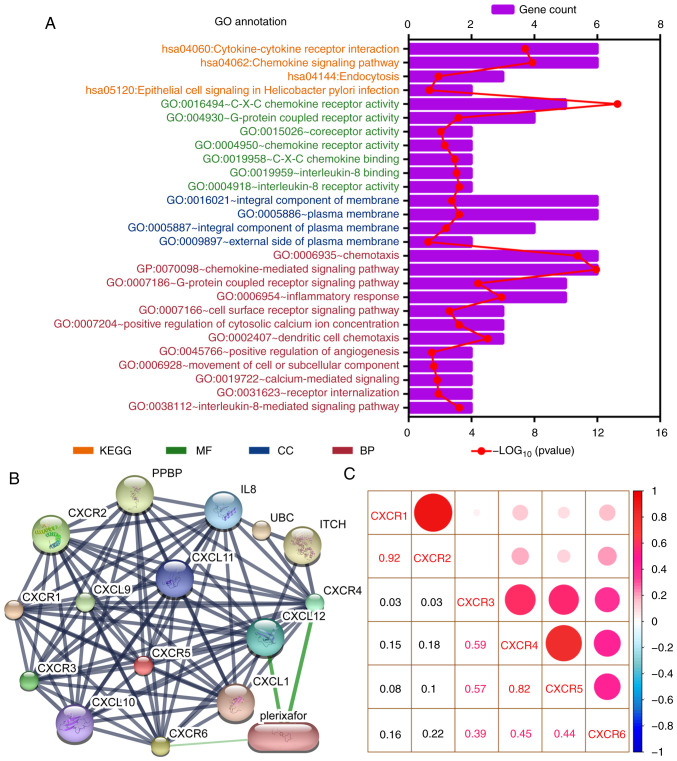
Figure 2.
Enrichment and correlation analysis of CXCR subunits. (A) GO term and KEGG pathway analysis using the Database for Annotation, Visualization, and Integrated Discovery. The vertical axis represents the KEGG pathways and GO terms, in which the CXCR subunits are enriched. The height of the histogram in the horizontal axis indicates the number of CXCR subunits enriched and the red dotted line represents the P-value of the enrichment analysis. (B) Drug target prediction using Search Tool for Interactions of Chemicals. Green edges indicate predictive drug association with target. (C) Correlation analysis for CXCR subunits in patients with early-stage pancreatic ductal adenocarcinoma. Red and blue represent positive and negative correlations, respectively. The size and color of the ball indicate the level of correlation coefficient. CXCR, C-X-C motif chemokine receptor; KEGG, Kyoto Encyclopedia of Genes and Genomes; GO, Gene Ontology; BP, biological process; CC, cellular component; MF, molecular function.

