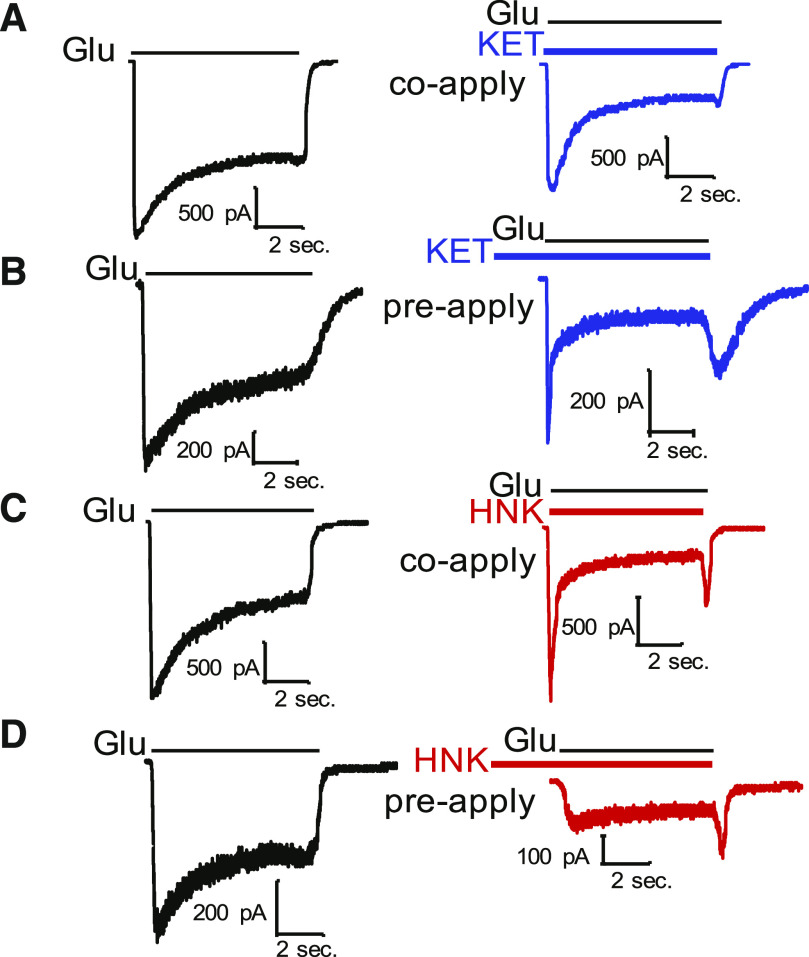
Fig. 4.
State dependence of KET and HNK inhibition. Exemplary whole-cell current traces obtained from N1/N2A receptors (pH 7.2) from the same cell when KET (10 µM; top, blue) or HNK (500 µM; bottom, red) were coapplied (A,C) or preapplied (B,D) relative to the agonist glutamate (n = 1 cell for all conditions shown).

