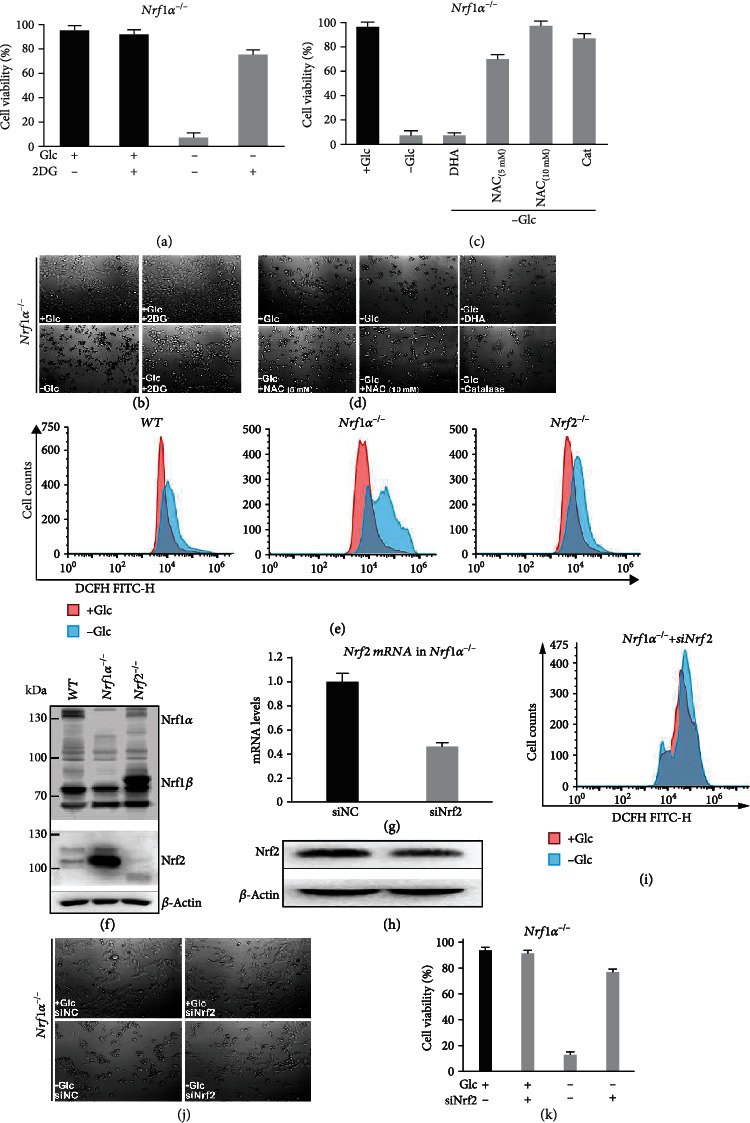
Figure 2.

Distinct redox states of starved or rescued Nrf1α−/− cells with different morphological changes. (a) Nrf1α−/− cells had been rescued by incubation for 24 h with 2-deoxyglucose (2DG, 10 mM in the glucose-free media), before the cell viability was determined by trypan blue staining. (b) Morphology of 2DG-rescued Nrf1α−/− cells was visualized by microscopy (with an original magnification of 200x). (c) Nrf1α−/− cell viability was calculated after they had been cultured for 24 h in glucose-free media containing N-acetyl-cysteine (NAC at 5-10 mM), catalase (CAT at 50 units/ml), or dehydroascorbic acid (DHA at 100 μM). (d) Morphological changes of Nrf1α−/− cells, which had been treated with NAC, CAT or DHA, were observed by microscopy (with an original magnification of 200x). (e) Distinct ROS levels were determined by flow cytometry analysis of WT, Nrf1α−/−, and Nrf2−/− cells that had been starved, or not starved, for 12 h. (f) Abundances of Nrf1 and Nrf2 proteins were determined by Western blotting of WT, Nrf1α−/−, and Nrf2−/− cells. (g, h) The interference of siNrf2 in Nrf1α−/− cells was identified by RT-qPCR (g) and Western blotting (h). (i) Changes in ROS levels of Nrf1α−/−+siNrf2 cells were analyzed by flow cytometry after 12 h of glucose deprivation. (j) The effects of siNrf2 on glucose-starved cell morphology were observed by microscopy (with an original magnification of 200x). (k) Nrf1α−/−+siNrf2 cell viability was evaluated after they had been subjected to glucose starvation for 24 h.
