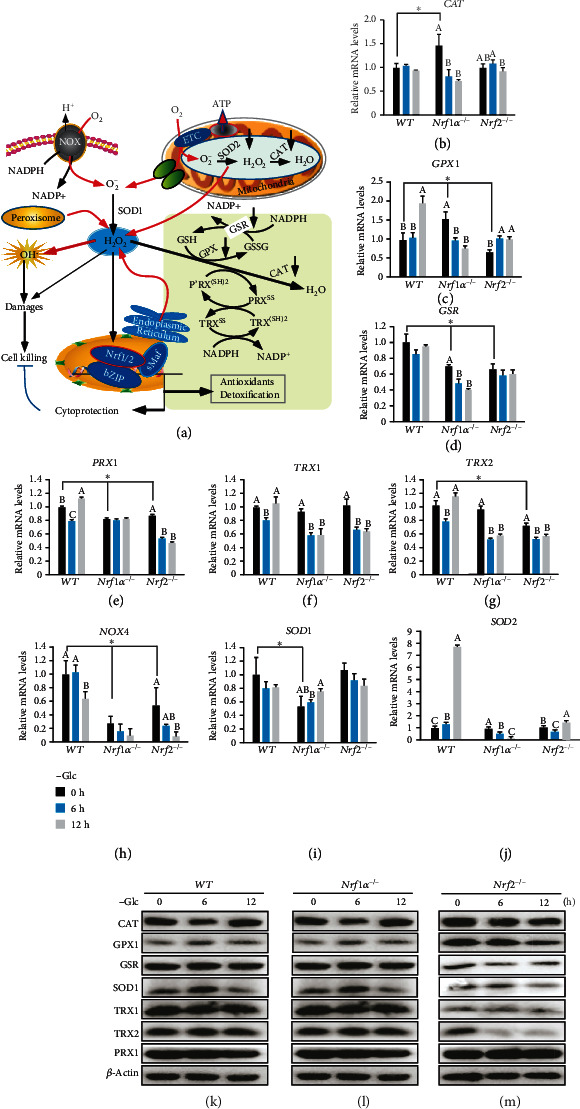
Figure 3.

Dysfunction of redox signaling controls and defense systems in glucose-starvated Nrf1α−/− cells. (a) Schematic representation of intracellular ROS products, along with redox signaling controls and antioxidant defense systems. In this response, Nrf1 and Nrf2 can be induced to translocate the nucleus, in which its functional heterodimer with sMaf or other bZIP proteins is formed in order to transcriptionally regulate distinct subsets of ARE-driven genes, which are responsible for antioxidant, detoxification, and cytoprotection against a variety of cellular stress. (b–j) Alterations in mRNA expression levels of distinct genes, such as (b) GSR (glutathione disulfide reductase), (c) CAT (catalase), (d) GPX1 (glutathione peroxidase 1), (e) PRX1 (peroxidase 1), (f) TRX1 (thioredoxin 1), (g) TRX2 (thioredoxin 2), (h) NOX4 (NADPH oxidase 4), (i) SOD1 (superoxide dismutase 1), and (j) SOD2 (superoxide dismutase 2), in WT, Nrf1α−/−, and Nrf2−/− cells, which had been or had not been starved in glucose-free media for 0-12 h, were determined by RT-qPCR analysis. Then, the asterisk “∗” only represents a significant change in WT, Nrf1α−/−, and Nrf2−/− cell lines in the glucose-free culture for 0 h (P < 0.05), while the letters A, B, and C represent significant changes in the same cell line without glucose cultured for 0, 6, and 12 h (P < 0.05). (k–m) Changes in abundances of the following proteins CAT, GPX1, GSR, SOD1, TRX1, TRX2, and PRX1 were visualized by Western blotting of WT (k), Nrf1α−/− (l), and Nrf2−/− (m) cells that had been or had not been glucose-starved for 0-12 h.
