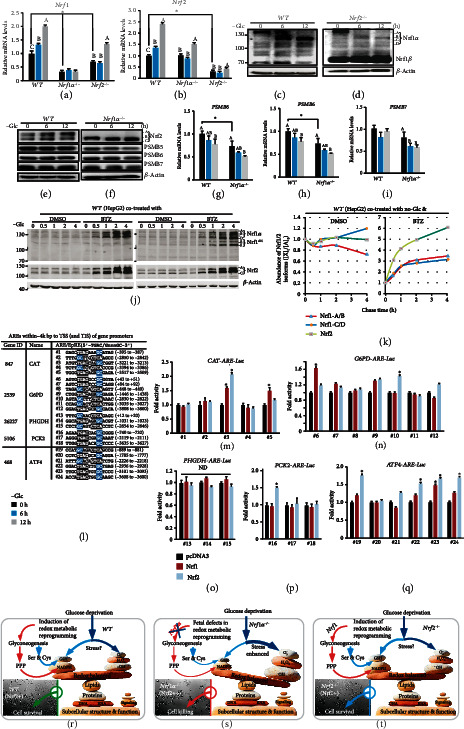
Figure 6.

Distinct requirements of Nrf1 and Nrf2 for the cytoprotective response to glucose deprivation. (a, b) Distinct mRNA levels of Nrf1 (Nfe2l1) (a) and Nrf2 (Nfe2l2) (b) were determined by RT-qPCR analysis of WT, Nrf1α−/−, and Nrf2−/− cells, which had been starved, or not starved, for 0-12 h in the glucose-free media. Then, the asterisk “∗” only represents a significant change in WT, Nrf1α−/−, and Nrf2−/− cell lines in the glucose-free culture for 0 h (P < 0.05), while the letters A, B, and C represent significant changes in the same cell line without glucose cultured for 0, 6, and 12 h (P < 0.05). (c, d) Changes in Nrf1-derived protein isoforms in WT (c) and Nrf2−/− (d) cells were visualized by Western blotting after glucose deprivation for 0-12 h. (e, f) Western blotting of Nrf2, PSMB5, PSMB6, and PSMB7 proteins in WT (e) and Nrf1α−/− cells (f) was conducted after 0-12 h of glucose deprivation. (g–i) Alterations in mRNA levels of PSMB5 (g), PSMB6 (h), and PSMB7 (i) in WT and Nrf1α−/− cells were determined after glucose starvation for 0-12 h. the asterisk “∗” only represents a significant change in WT and Nrf1α−/− cell lines in the glucose-free culture for 0 h (P < 0.05), while the letters A, B, and C represent significant changes in the same cell line without glucose cultured for 0, 6, and 12 h (P < 0.05). (j) WT cells were or were co-treated for 0-4 h in the glucose-free media containing 1 μmol/L bortezomib (BTZ, a proteasomal inhibitor) or 0.1% DMSO vehicle, followed by Western blotting with antibodies against Nrf1 or Nrf2. (k) The intensity of the immunoblots representing distinct Nrf1-derived isoforms or Nrf2 proteins, respectively, in the above-treated WT cells (j) was quantified by the Quantity One 4.5.2 software, and then shown graphically. (l) 24 of the indicated ARE-adjoining sequences searched from the promoter regions of CAT, G6PD, PHGDH, PCK2, and ATF4 were cloned into the pGL3-Promoter vector, and the resulting contrasts served as ARE-driven luciferase (ARE-Luc) reporter genes. (m-q) WT cells were cotransfected with each of the above indicated ARE-Luc or non-ARE-Luc (as a background control) plasmids, together with an expression construct for Nrf1, Nrf2, or empty pcDNA3.1 vector, then allowed for 24-h recovery before the luciferase activity measured. The results were calculated as a fold change (mean ± S.D., n = 9) of three independent experiments. Then, the asterisk “∗” represents a significant change induced by expression Nrf1 or Nrf2, relative to that obtained from the empty pcDNA3.1 vector, in cotransfection with the same ARE-Luc (P < 0.05 and change folds >1.4). ND, nonsignificant difference. (r–t) Three distinct models are proposed to provide a better understanding of molecular basis for survival or death decisions made by glucose-starved WT (r), Nrf1α−/− (s), and Nrf2−/− (t) cells. In redox metabolic reprogramming caused by glucose deprivation, the glycosis was diminished or abolished, and thus replaced by increased glyconeogenesis. As a result, many of their intermediates are diverted to enter the PPP and serine-to-glutathione biosynthesis pathways, in order to yield certain amounts of GSH and NADPH. These two reducing agents enable cytoprotective adaptation to oxidative stress induced by glucose deprivation (r). However, rapid death of Nrf1α−/− cells results from its fatal defects in the redox metabolic reprogramming in cellular response to glucose starvation, as accompanied by severe oxidative stress and damage accumulation (s). Thereby, Nrf1 is reasonable as a dominant player in the key gene regulation of redox metabolic reprogramming caused by glucose deprivation. As a result, the existence of Nrf1 in Nrf2−/− cells can still endow their survival with its redox metabolic reprogramming in a rebalanced redox state (t).
