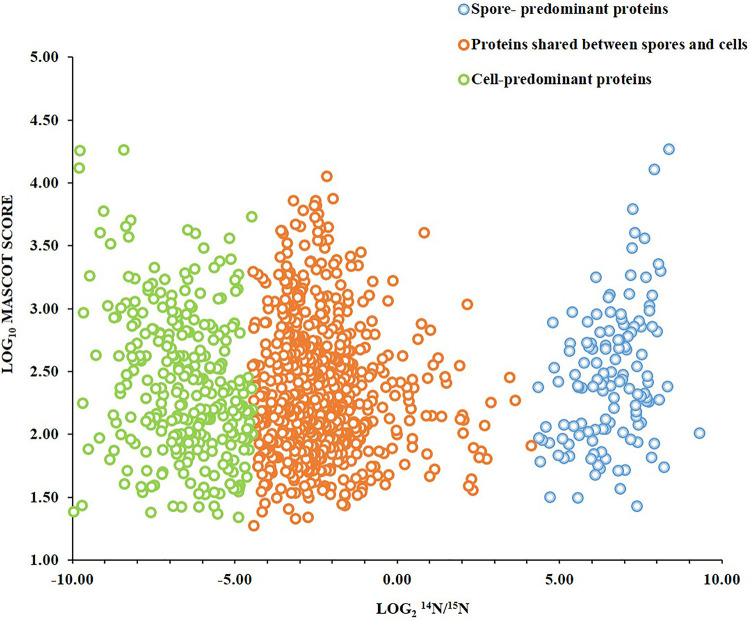
FIG 2.
Distribution of proteins in Bacillus subtilis spores and vegetative cells. MASCOT scores indicate the combined spore and cell abundances of a protein versus its 14N/15N protein isotopic ratio, which represents the relative levels of the protein in the spores and in the vegetative cells. Blue circles indicate spore-predominant proteins (14N/15N > 20), green circles indicate vegetative cell-predominant proteins (14N/15N < 0.05), and orange circles indicate proteins shared between spores and vegetative cells (20 > 14N/15N > 0.05). In this study, 130 proteins were found to be spore predominant, while 299 proteins were cell predominant. Of the remaining 657 shared proteins, only 7% were found to be enriched in spores, with 14N/15N ratios between 1 and 20, while 93% were found to be enriched in cells, with 14N/15N ratios between 1 and 0.05.

