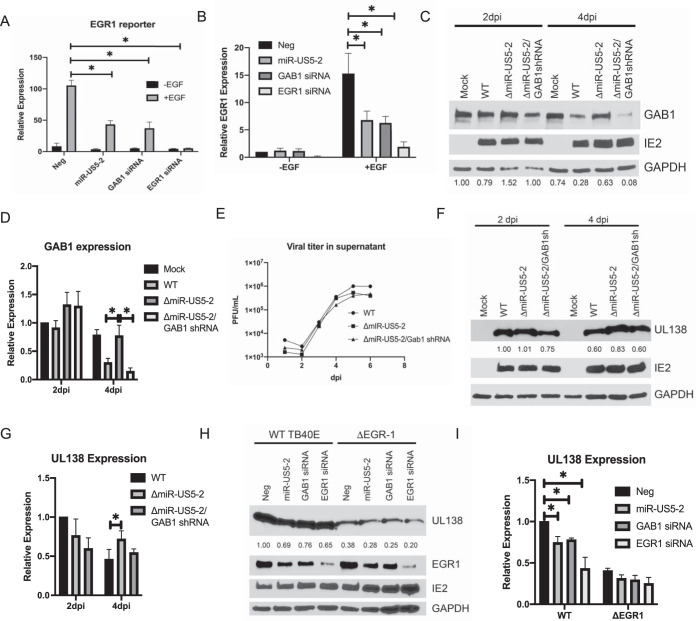
FIG 4.
HCMV miR-US5-2 affects UL138 expression during viral infection through targeting GAB1 for downregulation. (A) HEK293T cells were transfected with an EGR-1 luciferase reporter construct along with negative-control miRNA, miR-US5-2 mimic, and GAB1 or EGR-1 siRNA. After 24 h, cells were serum starved for 4 h and treated with EGF (5 ng/ml) for an additional 4 h or left untreated. Cells were lysed, and luciferase expression was measured. Experiments were performed in triplicate, and data are presented relative to results from negative-control transfected cells treated with EGF. Data are presented as standard errors of the means. *, P < 0.05 (as determined by two-tailed two-sample t test). (B) NHDF were transfected and treated as described for panel A, with EGF (5 ng/ml) being added for 1 h. RNA was harvested, and qRT-PCR was used to analyze EGR-1 expression normalized to 18S. *, P < 0.05 (as determined by two-tailed two-sample t test). (C) NHDF were infected with the indicated viruses at a multiplicity of infection (MOI) of 3 for 2 and 4 days, after which time protein lysates were harvested and subjected to immunoblotting for GAB1, HCMV IE2, and GAPDH. Band intensities were calculated using ImageJ software. The ratio of GAB1 to GAPDH band intensities was set to 1 for the Mock 2 day postinfection (dpi) sample, and each subsequent sample ratio is presented as a multiplier of the Mock time point. The experiment was performed in duplicate. (D) Quantitation of GAB1 protein levels compared to GAPDH from 2 Western blots using ImageJ software as described for panel C. (E) NHDF were infected as described for panel C, cell supernatants were harvested at the indicated time points, and titers were determined on NHDF. (F) NHDF were infected as described for panel C, and protein lysates were harvested at the indicated times and subjected to immunoblotting for HCMV UL138, IE2, and GAPDH. Band intensities were calculated using ImageJ software. The ratio of UL138 to GAPDH band intensities was set to 1 for the WT 2 dpi sample, and each subsequent ratio is presented as a multiplier of the WT 2 dpi time point. The experiment was performed in triplicate. (G) Quantitation of UL138 expression compared to GAPDH from 3 Western blots using ImageJ software as described for panel D. (H) NHDF were transfected with negative-control miRNA, miR-US5-2 mimic, or siRNAs targeting GAB1 or EGR1 followed by infection with WT or ΔEGR1 viruses. At 48 h later, infected cells were serum starved and treated with EGF (5 ng/ml) for 2 h, after which time protein lysates were obtained and immunoblotted for UL138, IE2, and GAPDH. Band intensities were calculated using ImageJ software. The ratio of UL138 to GAPDH band intensities was set to 1 for negative-control transfected WT samples, and each subsequent ratio was presented as a multiplier of the negative-control transfected WT sample. Experiment was performed in duplicate. (I) Quantitation of UL138 expression compared to GAPDH from 2 Western blots using ImageJ software as described for panel G.

