FIG 1.
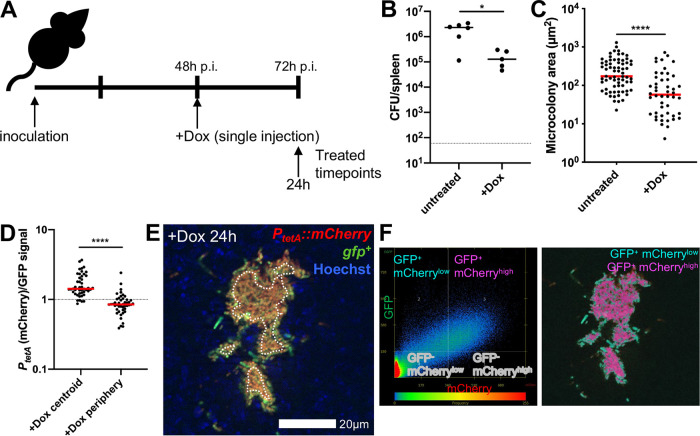
Doxycycline differentially diffuses across microcolonies. (A) Timeline for mouse infections. C57BL/6 mice were inoculated intravenously (i.v.) with 103 green fluorescent protein-positive (GFP+) PtetA::mCherry Y. pseudotuberculosis. Mice were treated at 48 h postinoculation (h p.i.) with 40 mg/kg Dox (Dox) in 100 μl PBS, administered intraperitoneally (i.p.), and spleens were harvested at the indicated time points to quantify CFU or process tissue for fluorescence microscopy. (B) CFU/spleen quantification from treated (+Dox, 24 h) or untreated mice (72 h). Dots indicate individual mice. (C) Fluorescence microscopy of spleens to quantify microcolony area (μm2) from treated (+Dox) or untreated mice, based on GFP signal. Dots indicate individual microcolonies. (D) Reporter signals were quantified from peripheral and centroid cells within treated microcolonies in the spleen, and reporter signal was divided by GFP. (E) Representative image; cells outside dotted white line are defined as peripheral. (F) Colocalization analysis of image shown in panel E, to show differential reporter signal by pseudocolor. Dot plot depicts signal intensity for each pixel within the image. Quadrants were set using GFP+ signal to distinguish bacteria from surrounding tissue; within this gate, the 66% highest mCherry pixels are shown as mCherryhigh (fuchsia), and the lowest 34% mCherry pixels are shown as mCherrylow (teal). Mouse infections were completed in three distinct experiments, and animal numbers depicted in Fig. 2B were processed for fluorescence microscopy (shown in Fig. 2C to F); medians are shown. Statistics: Mann-Whitney in panels B and C and Wilcoxon matched pairs in panel D. *, P < 0.05; ****, P < 0.0001.

