FIG 8.
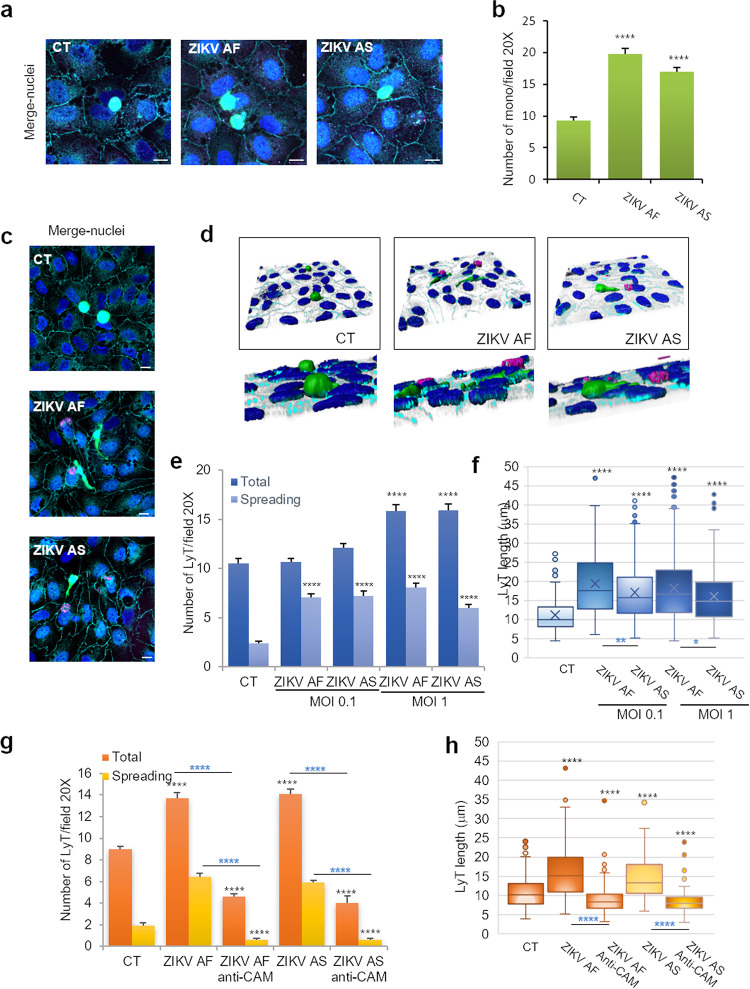
Increased recruitment of leukocytes in ZIKV-infected human BBB. hBLECs grown on cell culture inserts were infected with ZIKV AF and ZIKV AS (MOI, 1 or 0.1) for 7 days; 104 monocytes (a) or lymphocytes CD4+ (LyT) (c) prestained with CFSE were added to hBLECs for 30 min. (a) Mock-, ZIKV AF-, and ZIKV AS-infected BBB models grown on cell culture insert were fixed after incubation with monocytes at 7 dpi. Indirect IF studies were used to visualize monocyte (green) interaction with hBLECs: merged image shows also ZIKV (pan-flavivirus, magenta), ZO-1 (cyan) and Hoechst (blue). Scale bars 10 μm. (b) Quantitative analyzes of monocyte numbers per field (20×). Results are expressed mean ± SEM (30 fields per conditions per experiments (≥450 cells, n = 3)) and analyzed using a Wilcoxon-Mann-Whitney test. ****, P < 0.0001 compared to CT. (c) Mock- and ZIKV AF- and ZIKV AS-infected BBB model grown on cell culture insert were fixed after incubation with LyT at 7 dpi. Indirect IF studies were used to visualize LyT (green) interaction with hBLEC: merge images show also ZIKV (pan-flavivirus, magenta), ZO-1 (cyan), and Hoechst (blue). Bars, 10 μm. (d) 3D rendering of LyT interaction with mock-, ZIKV AF-, and ZIKV AS-infected BBB models. Confocal stacks of images shown in panel c were subjected to 3D reconstruction with the Imaris software (ZO-1, cyan; LyT, green; ZIKV, magenta; and nuclei, blue). (e) Quantitative analyses of LyT numbers per field (20×) in CT and ZIKV-infected BBB (MOI, 0.1 and 1). Cells elongated qualified as “spreading.” Results are expressed means ± SEMs (30 fields per conditions per experiments [≥320 cells, n = 3]) and analyzed using a Wilcoxon-Mann-Whitney test. ****, P < 0.0001 compared to CT. (f) LyT cell length (in microns) in CT and ZIKV-infected BBB (MOI, 0.1 and 1). Data are expressed as boxes and whiskers (≥300 cells, n = 3) and analyzed using a Wilcoxon-Mann-Whitney test. *, P < 0.05; **, P < 0.01; ****, P < 0.0001. Black asterisks show differences compared to CT conditions, while blue asterisks show differences between ZIKV AF and ZIKV AS. (g) To monitor CAM involvement in LyT binding/recruitment, hBLECs were incubated with a cocktail of blocking antibodies against ICAM-1, VCAM-1, and E-selectin 1 h prior to LyT incubation. Quantitative analyses of LyT numbers per field (20×) in CT and ZIKV-infected BBB (MOI, 1). Results are expressed means ± SEMs (30 fields per conditions per experiments [n = 3]) and analyzed using a Wilcoxon-Mann-Whitney test. ****, P < 0.0001 compared to CT. Black asterisks show differences compared to CT conditions, while blue asterisks show differences between ZIKV AF/AS and ZIKV AF/AS treated with anti-CAM antibodies. (h) LyT cell length (in microns) in CT and ZIKV-infected BBB (MOI, 1) after CAM blocking. Results are expressed means ± SEMs (30 fields per conditions per experiments [n = 3]) and analyzed using a Wilcoxon-Mann-Whitney test. ****, P < 0.0001 compared to CT. Black asterisks show differences compared to CT conditions, while blue asterisks show differences between ZIKV AF/AS and ZIKV AF/AS treated with anti-CAM antibodies.

