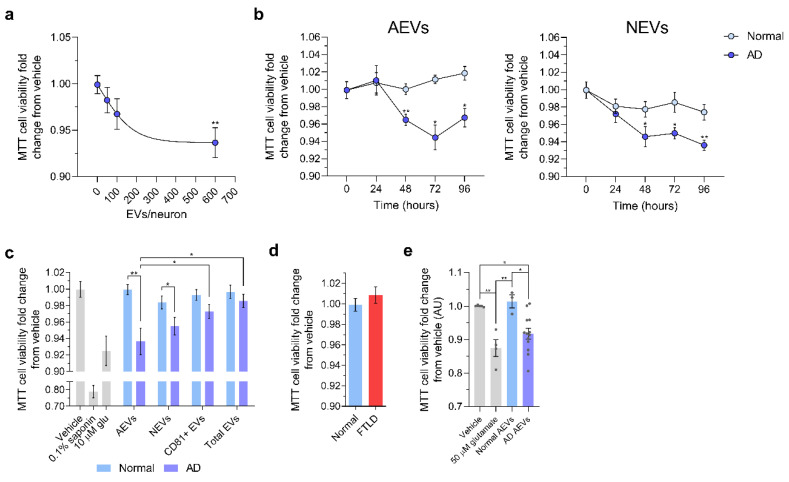
Figure 1.
Alzheimer’s disease (AD) astrocytic-origin extracellular vesicles (AEVs) and neuronal-origin extracellular vesicles (NEVs) impair neuronal viability. (a) Scatter dot plot showing the MTT cell viability fold-change from vehicle of E18 rat cortical neurons treated with AD AEVs in a concentration-dependent manner. Each dot represents the mean value ± the standard error obtained from neurons treated with plasma-derived AEVs from 7 AD participants at the indicated concentration or vehicle (0 EVs/neuron) in triplicates. Trendline shows the four-parameter logistic nonlinear regression. ** p = 0.0015, 600 vs. 0 EVs/neuron; one-way ANOVA corrected for multiple comparisons using the Dunnet test. (b) Scatter dot plots with the connecting line showing the MTT cell viability fold-change from the vehicle of E18 rat cortical neurons treated in triplicates with AEVs or NEVs from 7 AD participants and 6 normal controls at 600 EVs/neuron, in a time-dependent manner. Each dot represents the mean value ± SEM. AD vs. Normal: AEVs, 48 h ** p = 0.0015, 72 h * p = 0.0191, 96 h * p = 0.0201; NEVs, 48 h * p = 0.0337, 72 h * p = 0.0127, 96 h ** p = 0.0016; two-tailed unpaired t-test with a confidence interval of 95%. Time-dependent EV treatment vs. vehicle treatment (0 h): AEVs, 48 h ** p = 0.0060, 72 h **** p < 0.0001, 96 h ** p = 0.0023; NEVs, 48 h **** p < 0.0001, 72 h * p = 0.0186; 96 h ** p = 0.0028; ordinary one-way ANOVA. (c) Bar graph showing a significant decrease in MTT cell viability (fold-change from vehicle) in E18 rat cortical neurons treated with AEVs and NEVs, but not CD81+ EVs and total plasma EVs from 7 AD participants, compared to neurons treated with AEVs and NEVs from 6 normal controls, respectively. Neurons treated with 0.1% saponin detergent and 10 μM glutamate were used as positive controls for neurotoxicity. Each bar represents the mean value ± SEM from triplicate wells and five different experiments; the condition of 600 EVs/neuron and incubation for 48 h was selected based on a, b. Analysis was based on mixed linear model accounting for technical (well, experiment) and biological (Subject, Group) variability and including all EV types. For NEVs, AD vs. Normal, p = 0.003. For AEVs, AD vs. Normal, p = 0.006. For CD81+ EVs, AD vs. Normal, p = 0.904. For total EVs, AD vs. Normal, p = 0.675. For AD participants, NEVs and AEVs had similar effects on MTT (AEVs vs. NEVs, p = 0.695), but AEVs decreased MTT compared to both CD81+ (p = 0.035) and total EVs (p = 0.029), and NEVs showed similar strong trends in pairwise comparisons (p = 0.087 and p = 0.067 respectively). * p < 0.05, ** p < 0.01. (d) Bar graph showing the MTT cell viability fold-change from the vehicle of neurons treated with AEVs from two FTLD and 6 normal control participants. No difference in cell viability was observed (p = 0.934). Treatments were carried out as indicated in (c). Bar graph showing a significant decrease in MTT cell viability in E18 rat cortical neurons treated with AEVs from 13 autopsy-confirmed AD patients and 3 neurologically normal controls from JH ADC, all part of an independent cohort different from that used for (a–e). Each bar represents the mean value ± SEM from five wells and two independent experiments. Vehicle vs. 50 µM glutamate, ** p= 0.0038; Vehicle vs. AD AEVs, * p = 0.0225; 50 µM glutamate vs. Normal AEVs, ** p = 0.0048; Normal AEVs vs. AD AEVs, * p = 0.0225.

