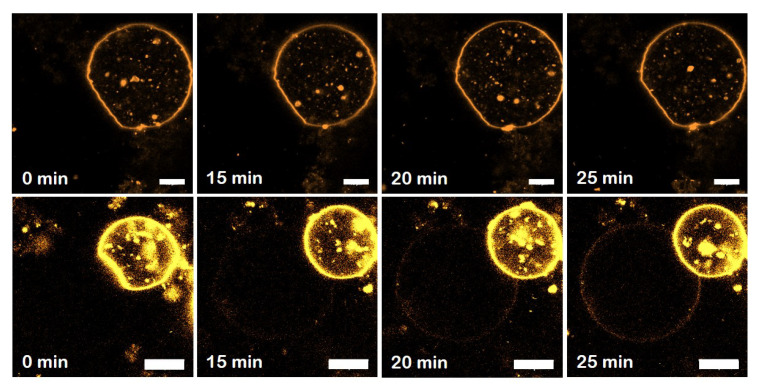
Figure 6.
Time evolution of lipid mixing assay in GUVS bearing Mfn1-induced adhesion. Lipid mixing was monitored when fluorescence intensity was observed on the non-labelled vesicle after adhesion of two GUVs, one of them labelled with Rh-PE (0.5%mol). In 90% cases (N = 10) no fluorescence redistribution between vesicles was observed (top row). Only in one case, a fluorescent signal appeared in the non-labelled vesicle, suggesting lipid mixing (bottom row). Note that the equilibrium was only reached after 20–30 min. Scale bars are 10 μm.

