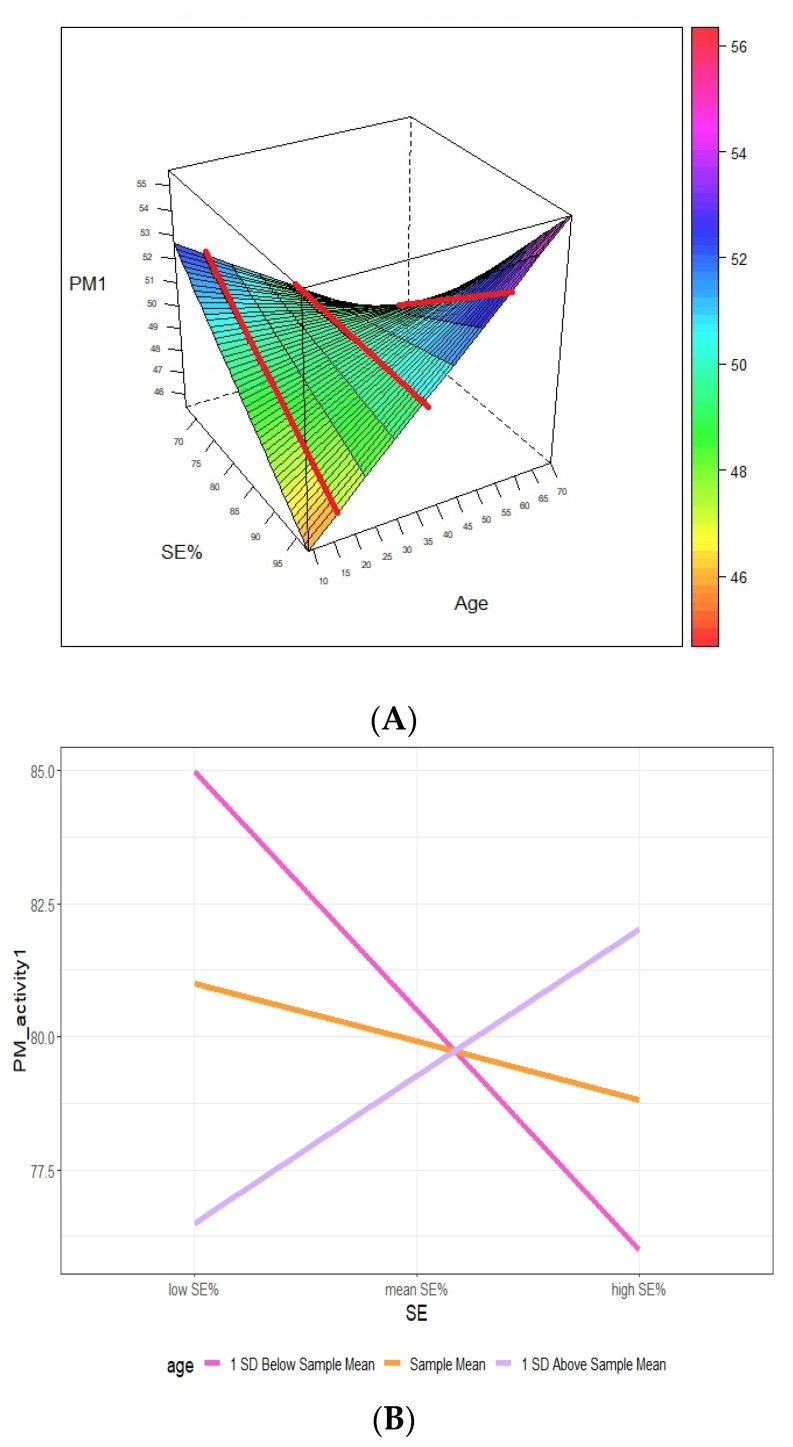
Figure 4.
The relationship between SE (%) and PM activity 1 (%) at high, average, and low levels of age. (A) A three-dimensional (3D) graph of the relationship; (B) classical scatterplot of the relationship between variables. When the reference lines (red lines) drawn in Figure 4A are taken into account and rotated clockwise, they overlap, forming the configuration shown in Figure 4B.

