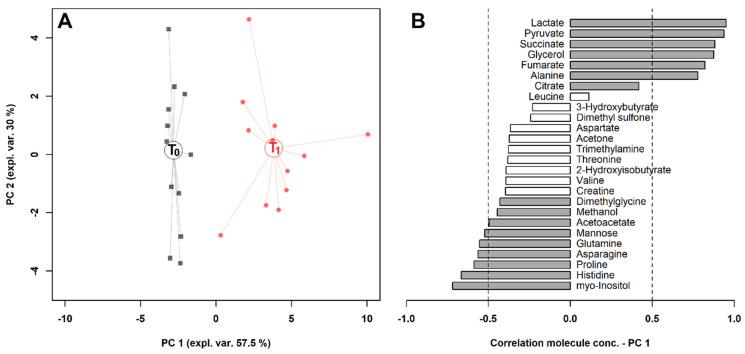
Figure 3.
rPCA model built on the space constituted by the concentration of the molecules significantly different in serum, listed in Table 1. (A) In the score plot, samples collected at T0 and T1 are represented with black squares and red circles, respectively. The wide, empty circles represent the median of the groups. (B) The loading plot reports the correlation between the concentration of each substance and its importance over principal component (PC) 1. Significant correlations (p < 0.05) are highlighted with gray bars.

