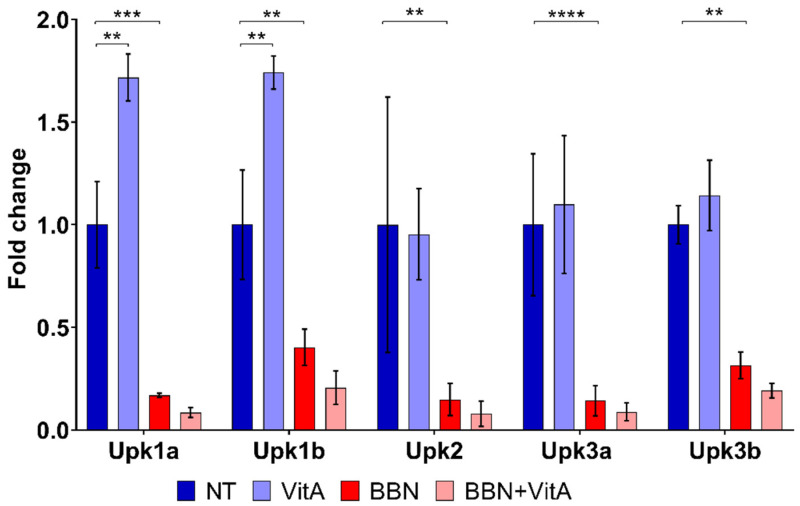
Figure 3.
Transcriptional expression profiles of uroplakin genes (Upk1a, Upk1b, Upk2, Upk3a, and Upk3b) in the bladder wall of four groups of animals: NT (n = 9), VitA (n = 6), BBN (n = 9), BBN + VitA (n = 9). Statistical analysis was performed using ANOVA followed by Tukey’s post hoc test; ** p < 0.005, *** p < 0.0005, **** p < 0.0001.

