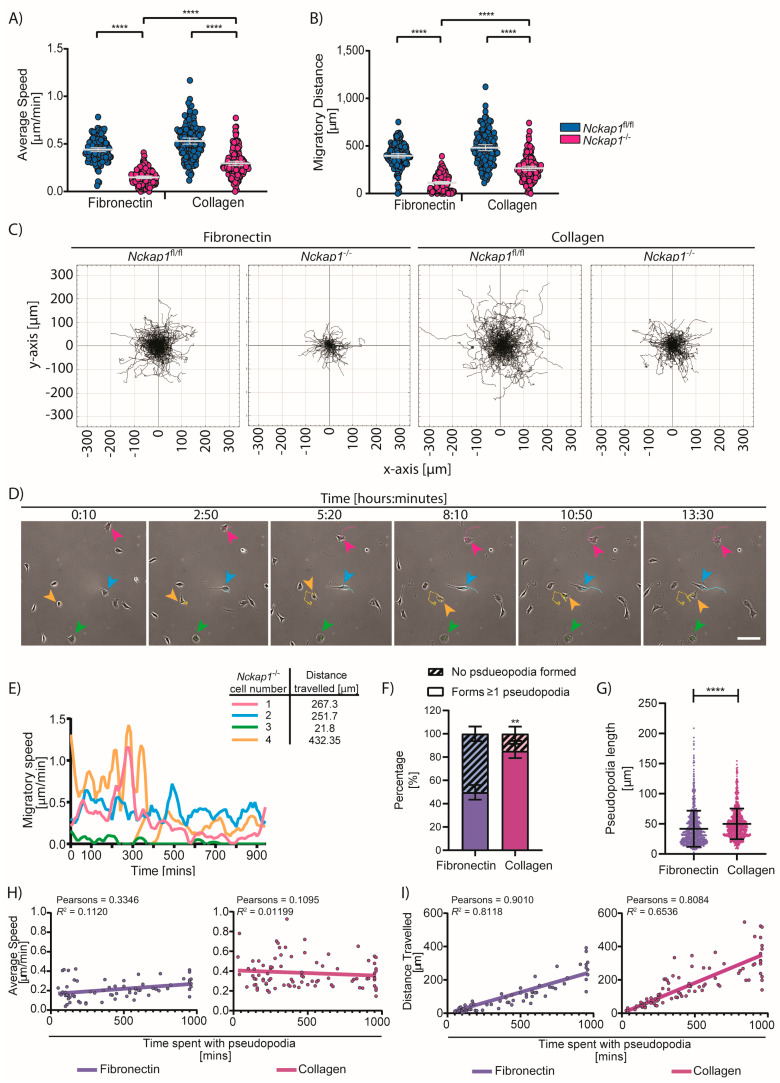
Figure 4.
Collagen can partially rescue the migratory defect in Nckap1 KO cells. The random migration assay of the control and Nckap1 KO cells migrating over fibronectin and collagen is shown. (A) Migratory distance travelled, (B) average migratory speed. The dot plots present mean and S.D. from >130 cells analysed for each condition from 2 independent experiments. Statistical significance was assessed using a 1-way ANOVA Kruskal-Wallis test, **** p < 0.0001. (C) Spider plots represent migratory paths and distance travelled. (D,E) Representative migratory profiles of four Nckap1 KO cells that represent rounded, pseudopod-like protrusions and cells that transition between the two phenotypes. Note: The green cell is rounded for the entire experiment and has very little speed or distance travelled. The cyan cell forms a pseudopod-like extension early and migrates at a steady speed throughout the experiment. Cells 3 and 4 (green and orange) transition between states and fast and slow bursts of speed over time that correlate with their shape. (D) Still images displaying a time-course of Nckap1 KO MEFs migrating over collagen. Time is shown as hours:minutes, and the scale bar represents 100 μm. Arrows pointing to the cell in question and its migration path are shown; see supporting video in Video S4. (E) Cell migration speed over time for the four cells in (D) analysed using the ImageJ MTrackJ plugin. Coloured lines on graph match the cells in (D). The migratory distance for each cell is also depicted. n = 4 cells from one video. (F) Percentage of Nckap1 KO cells that form pseudopod-like extensions within the 16 h experiment on either fibronectin or collagen. A total of 107 cells (fibronectin) and 93 cells (collagen) were analsyed from 3 movies each. The error bars represent S.D. Statistical significance was assessed using a two-tailed t-test with Welch’s correction, ** p < 0.01. (G) The length of these pseudopod-like extensions was determined from cells forming a protrusion every hour in a 16 h movie. A total of 854 (Fibronectin) and 862 (collagen) pseudopod-like extensions were measured. Error bars represent S.D. The error bars represent S.D Statistical significance was assessed using a two-tailed t-test with Welch’s correction, **** p < 0.0001. (H,I) Correlations between lifetimes of the pseudopod extensions with either speed (H) or migratory distance (I). A total of 68 cells (fibronectin) and 86 cells (collagen) were analsyed from 3 movies each. Pearson’s coefficient and R2 value are shown for each condition.

