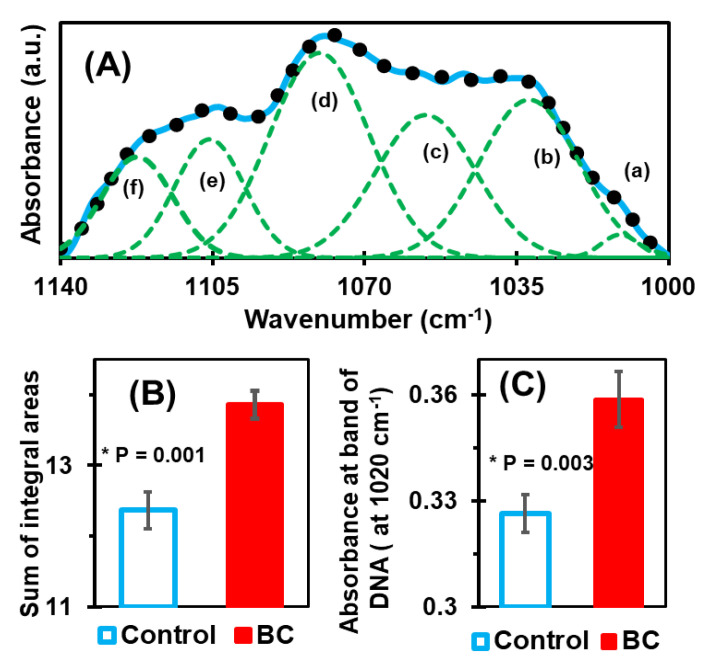
Figure 5.
(A) Deconvolution of the complex band of carbohydrates and nucleic acids at 1000–1140 cm−1. The number and position of the six bands used to fit the experimental curve were determined by using the minima of secondary curves, as in the amide I case. (B) Bar graph representation of the average value of the integral sum, which shows a significant difference between the control and BC case. (C) Bar graph of the average absorbances at wavenumber position 1020 cm−1, which is mainly due to the presence of DNA. It also shows a significant difference between the control and BC cases.

