Figure 1.
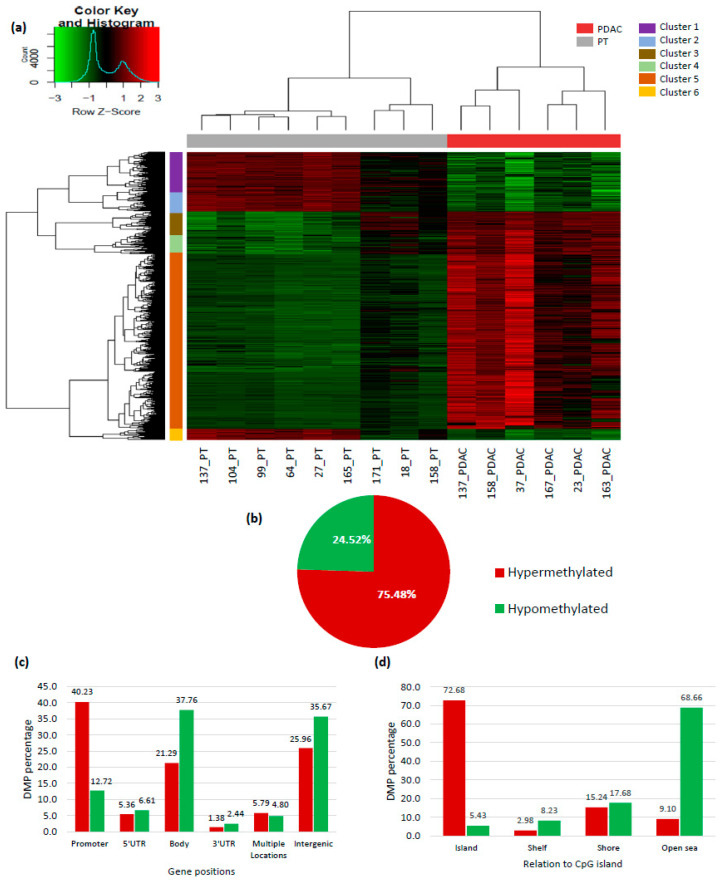
DNA methylation profile of pancreatic ductal adenocarcinoma. (a) Heatmap showing the unsupervised hierarchical clustering of pancreatic ductal adenocarcinoma (PDAC, with a minimum 70% cellularity) and non-tumoral adjacent pancreatic tissue (PT) according to the methylation profile of the 10,361 probes found to be differentially methylated between groups (adjusted p-value < 0.01 and ∆β ≥ 0.2). Hyper- and hypomethylation are represented in red and green, respectively. Colored bars on the left side of the heatmap represent probe clusters defined by their methylation similarities; (b) pie chart showing the percentage of hypomethylated and hypermethylated probes in PDAC relative to PT; (c) overall distribution of hypo- and hypermethylated probes according to their gene position; (d) overall distribution of hypo- and hypermethylated probes according to their relation to CpG islands.

