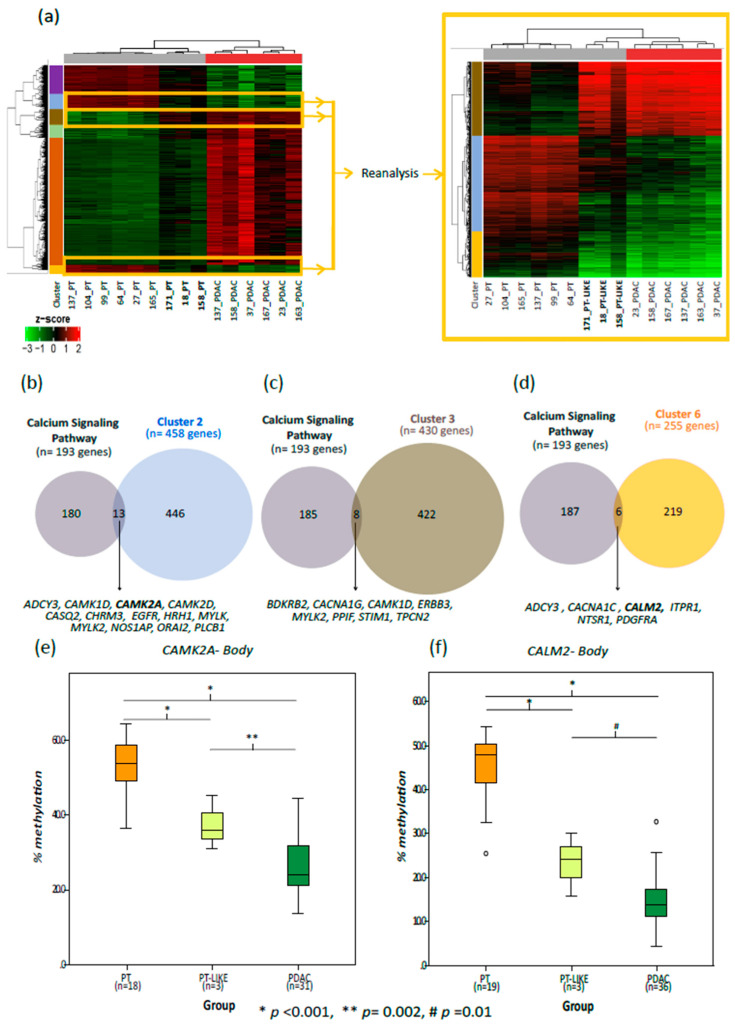
Figure 6.
Comparative DNA methylation analysis of the PT, PT-like and the PDAC samples. (a–d) Tissue samples with ≥70% cellularity. (a) Heatmaps highlighting the methylation profile of the probe clusters supposed to be altered in early stages of PDAC development. Heatmap on the left shows the 10,361 DMPs between the PDAC and PT. Clusters 2, 3 and 6 were selected for a detailed analysis (heatmap on the right) since their probes showed intermediate methylation levels (between PDAC and PT) in the PT-like samples; (b–d) the overlap between the genes involved in the calcium signaling pathway and the genes belonging to each selected probe cluster ((b) cluster 2; (c) cluster 3; and (d) cluster 6). (e,f) The boxplots representing the overall methylation level of CALM2 (e) and CAMK2A (f) in the PT, PT-like and the PDAC samples (≥20% cellularity). p-values were calculated using the generalized estimating equations.

