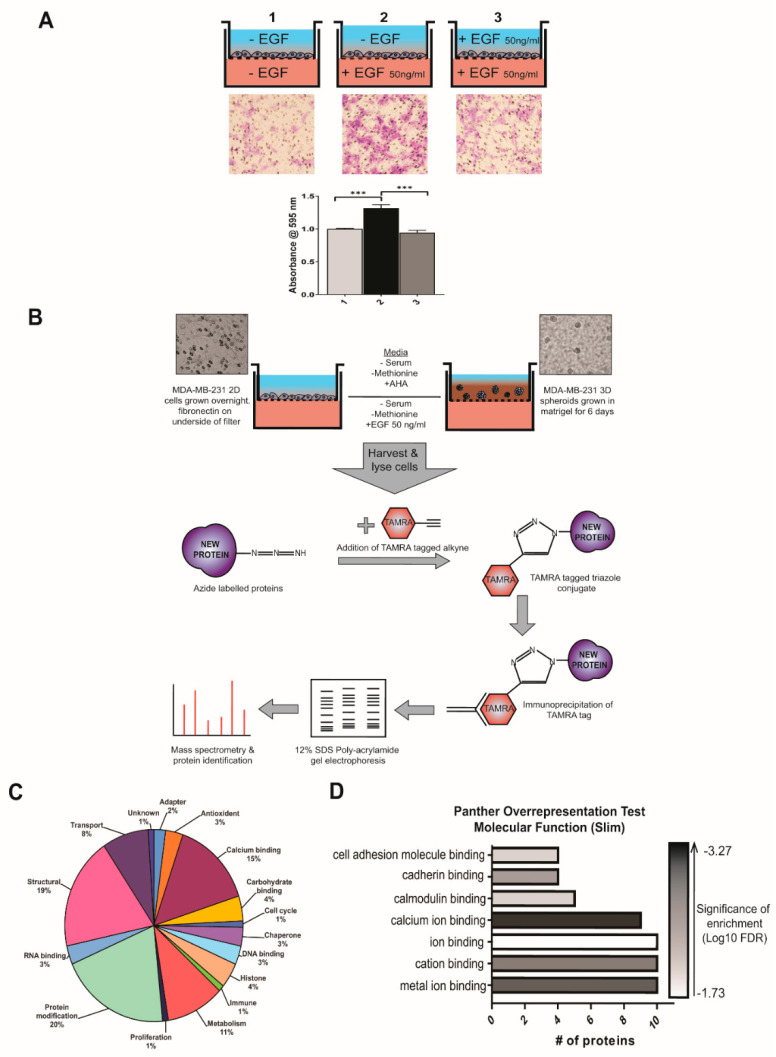
Figure 1.
Isolation, identification, and functional characterization of newly synthesized proteins in MDA-MB-231 migration and invasion. (A) MDA-MB-231 cells were plated in the upper chamber of transwell plates and media was supplemented (+/− EGF) according to diagram. Cell migration after 4 h was measured by crystal violet (CV) staining of cells which moved through the well and adhered to the underside of the membrane. Non-migrated cells were removed prior to staining. Membranes were then imaged using inverted microscope and migration of cells was quantified by dissolving of CV stain and measuring absorbance at 595 nm. Data displayed as mean ± SEM, of 3 independent experiments, CV absorbance normalized to average value for well 1. Statistical analysis by one way ANOVA, p = < 0.0001. (B) Flow chart of model set-up, isolation of newly synthesized proteins, and mass spectrographic analysis carried out in this study. (C) Characterization of identified newly synthesized proteins according to the NCBI database entries of each protein and displayed as pie chart. (D) Molecular function enrichment analysis was carried out using the PANTHER overrepresentation test. The numbers of proteins annotated with each molecular function was plotted as a bar chart with the color scale representing the significance of the enrichment of molecular function within the list.

