Figure 3.
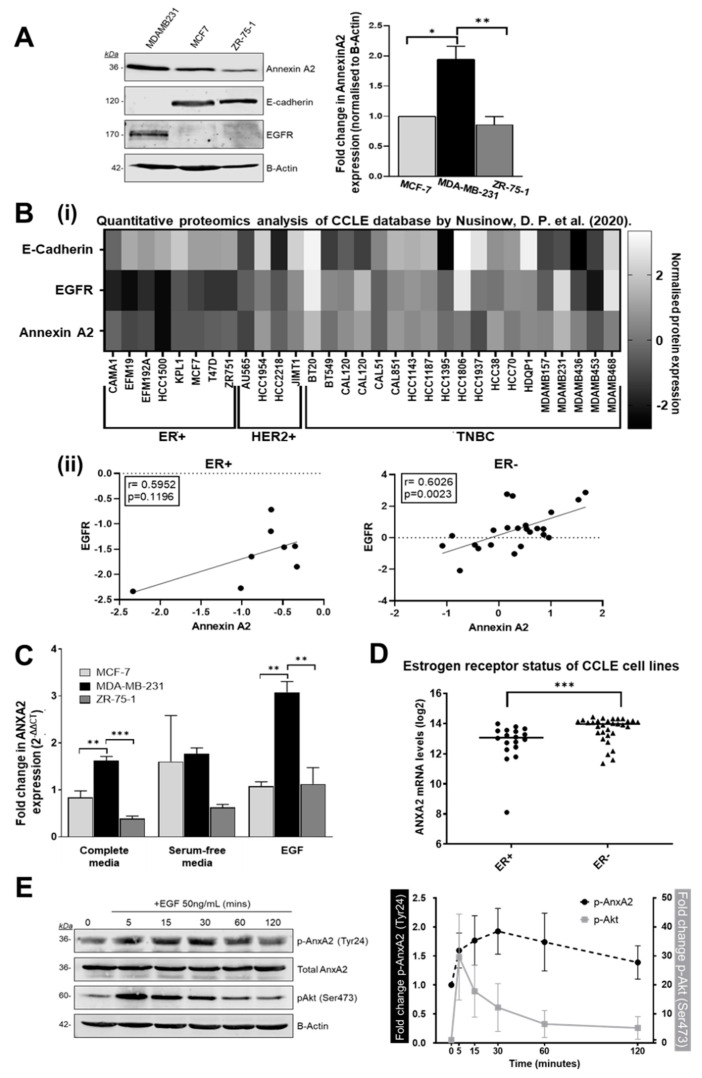
Annexin A2 expression is increased in ER negative breast cancer cells and undergoes transient phosphorylation following EGF stimulation. (A) Comparison of Annexin A2 expression in three breast cancer cell lines: MDA-MB-23, MCF-7 and ZR-75-1 as measured by SDS-PAGE and western blot. Protein expression was quantified by densitometric signal analysis on Image Studio software (LI-COR). Annexin A2 signal was normalized to beta-actin signal, then expressed in comparison to MCF-7 expression as 1. Data shown is mean +/− SEM for 3 individual experiments, measured by ANOVA with Bonferroni, p = 0.0034. (B) (i) Heatmap of Annexin A2, EGFR and E-Cadherin protein expression data for breast cancer cell lines from Nusinow, D. P. et al. (2020), stratified according to breast cancer subtype. Protein expression represented as normalized relative protein expression, as measured by quantitative proteomics. (ii) Scatterplots of the same data indicating the relationship between Annexin A2 and EGFR protein expression. A significant and strong positive correlation between Annexin A2 and EGFR expression is seen for ER- cell lines (Pearson’s correlation, r = 0.6026, p = 0.0023) (C) Gene expression of ANXA2 in three breast cancer cell lines: MDA-MB-231, MCF-7 and ZR-75-1. Expression was calculated using delta CT method and displayed as fold change (corrected RQ) in comparison to MCF-7 expression for each condition. (i.e., MCF-7 expression normalized to 1) differences between cell lines analyzed by ANOVA with Bonferroni. (D) Publicly available Affymetrix gene expression data for human breast cancer cell lines was obtained from the CCLE. Cell lines were categorized according to ER expression status and difference in ANXA2 expression between the 2 groups was measured using Mann–Whitney U test, p = 0.0008 (E) Western blot showing the effect of EGF stimulation on AnxA2 expression and phosphorylation in MDA-MB-231 cells. After 4 h of serum starvation, cells were treated with 50 ng/mL EGF. Representative blot and corresponding time course graph showing the increase in AnxA2 phosphorylation at Tyr24 followed by decrease after 30 min. Densitometry signal normalized as phosho-AnxA2/total AnxA2 and phospho-Akt/total beta-actin. Data points displayed as mean of 3 individual experiments ±SEM.

