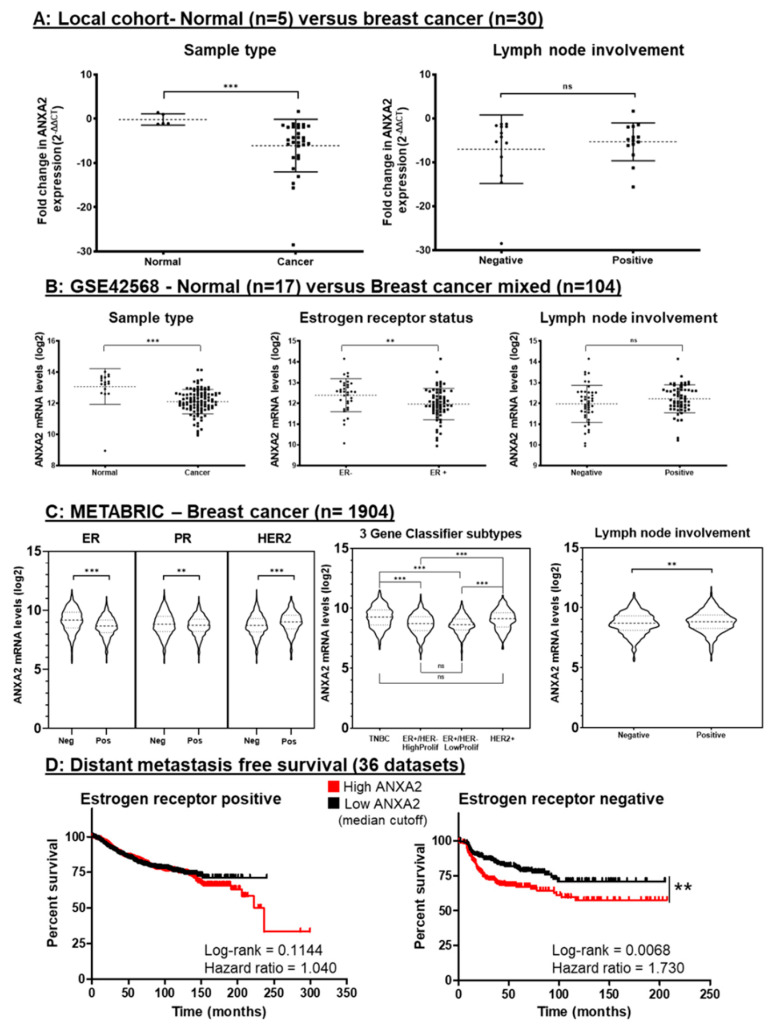
Figure 5.
ANXA2 expression is associated with and is a prognostic indicator in ER negative breast cancer. (A) Analysis of ANXA2 expression using qRT-PCR of normal (n = 5) and breast cancer (n = 30) tissue samples. Analysis showed ANXA2 is significantly upregulated in normal tissue versus cancer tissue (p = 0.0002). Gene expression represented as fold change from normal closest to mean. Horizontal bars represent the mean and SD of fold change. Statistical difference between groups tested using Mann Whitney U test. (B) Analysis of ANXA2 mRNA expression in GSE42568 showing ANXA2 is upregulated in normal tissue versus cancer tissue, (p < 0.0001), in ER- breast cancer versus ER+ breast cancer (p = 0.0094) and in patients with nodal positive disease (p = 0.1121). Horizontal bars represent the mean and SD gene expression levels. Statistical difference between groups was measured using Student’s t-test. (C) Analysis of ANXA2 mRNA expression of the METABRIC cohort showing upregulation of ANXA2 in ER negative (p < 0.0001), PR positive (p = 0.0013) HER2 positive (p < 0.0001) and in nodal positive (p = 0.0050) breast cancer patients. Using the 3 gene classifier (42) to stratify patients shows TNBC and HER2+ subtypes to have significantly higher expression of ANXA2 than both ER+/HER2- subtypes. Statistical difference between groups was calculated using Mann–Whitney U test. (D) Kaplan–Meier curves comparing the DMFS of patients with high ANXA2 expression (red) versus low ANXA2 expression (black) as determined by median expression value cut-off. Curves were analyzed using univariate log-rank tests. Expression of ANXA2 was found to not have a significant effect in ER+ patients whereas it did significantly increase probability of distant metastasis for ER- patients (p = 0.0068).

