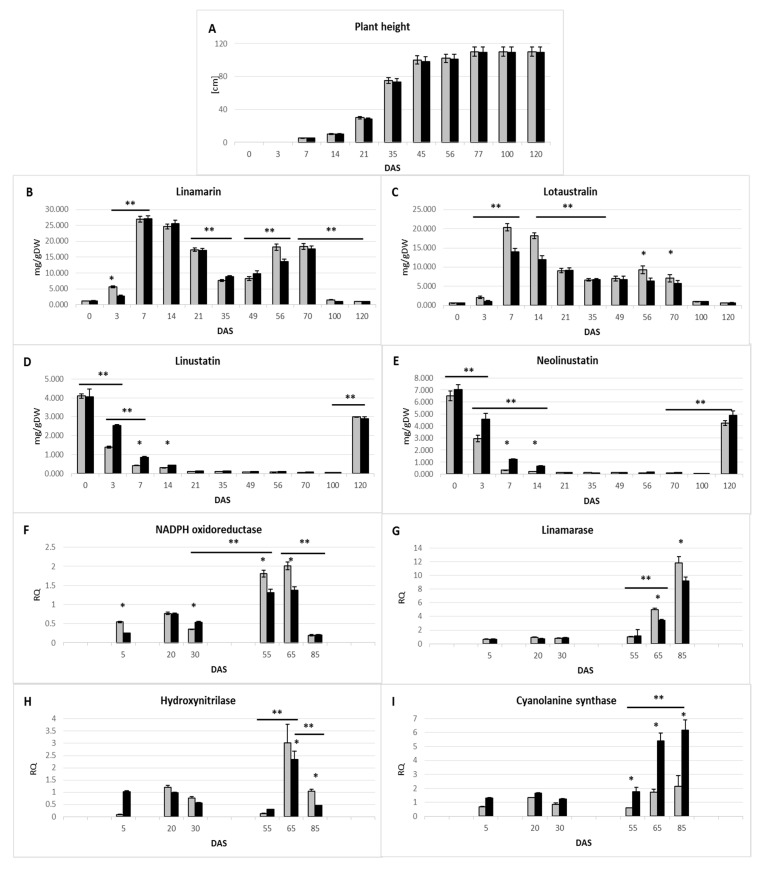
Figure 2.
Fluctuation in cyanogenic glucoside levels and expression of GC metabolism genes during plant growth in control and Met25 expressing plants (comparison). Plant growth in height (A); fluctuation of cyanogenic monoglucoside level (B,C); fluctuation of cyanogenic diglucoside level (D,E); the mRNA level of GC metabolism genes: NADPH oxidoreductase (F), linamarase (G), β-cyanoalanine synthase (H) and hydroxynitrilase (I) obtained from the real-time RT-PCR analysis. DAS, days after sowing; RQ, relative quantity. Data represent the mean ± standard deviations from at least three independent experiments. Data constitute the mean value ± SD from at least three technical repeats of three independent biological samples. The significance of the differences between the transgenic plant and control was determined by Student’s t-test. Asterisk indicates p < 0.05. For an indication of developmental changes, the ANOVA test was used—p value = 0.001 was indicated by asterisks and the line indicates the compared data range.

