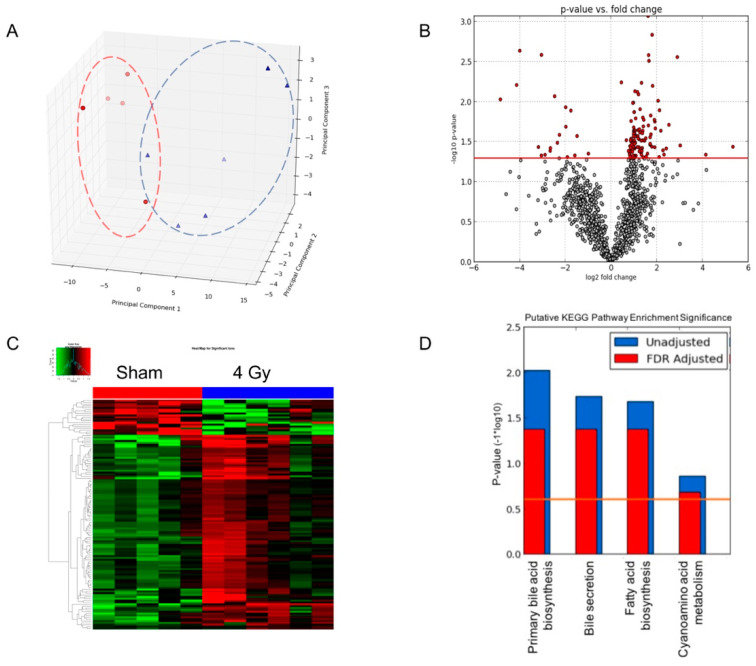
Figure 2.
Comparative analysis of serum metabolomic profiles of control mice and those exposed to 137Cs at a cumulative dose of 4 Gy with high dose rate. (A) The principal component analysis (PCA) plot showing separation of metabolomic signatures from 137Cs-exposed (blue triangles) and control mice (red circles). (B) The volcano plot highlights statistically significant metabolites post-exposure (red dots). The p-value cutoff is 0.05. (C) The heatmap of metabolites whose levels changed significantly. (D) Molecular pathway enrichment analysis results of the differential ions identified in the multivariate analysis of serum metabolomic profiles.

