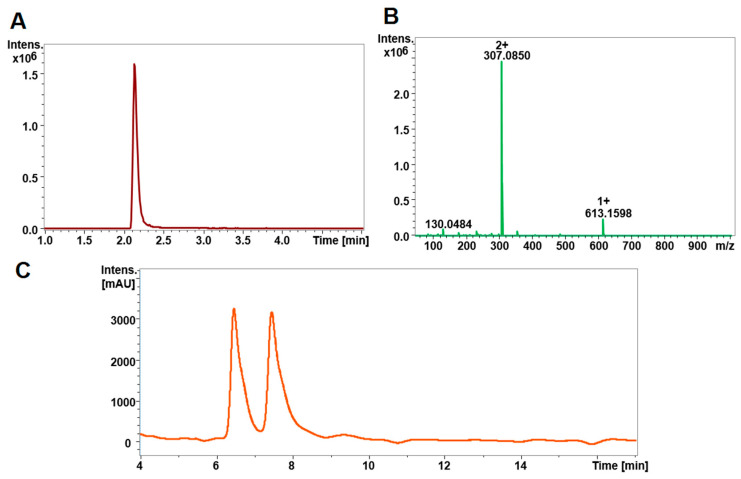
Figure 1.
Chromatographic separation and detection of GSSG and GS-NEM. (A) Extracted ion chromatogram (XIC) and (B) mass spectrum of GSSG standard measured by HPLC-ESI-QTO-FMS. (C) GS-NEM was measured by HPLC-UV and the trace at 210 nm is shown. The doubly charged ion of GSSG at m/z 307 in Figure 1B was used for GSSG determination throughout the study. In Figure 1C, two separate GS-NEM peaks at 6.7 min and 7.8 min, respectively, were observed due to the generation of diastereomers. The peak at 6.7 min was chosen for GS-NEM determination.

